29
/it/
it
AIzaSyAYiBZKx7MnpbEhh9jyipgxe19OcubqV5w
April 1, 2024
163944
Japan
JPN
true
2
1
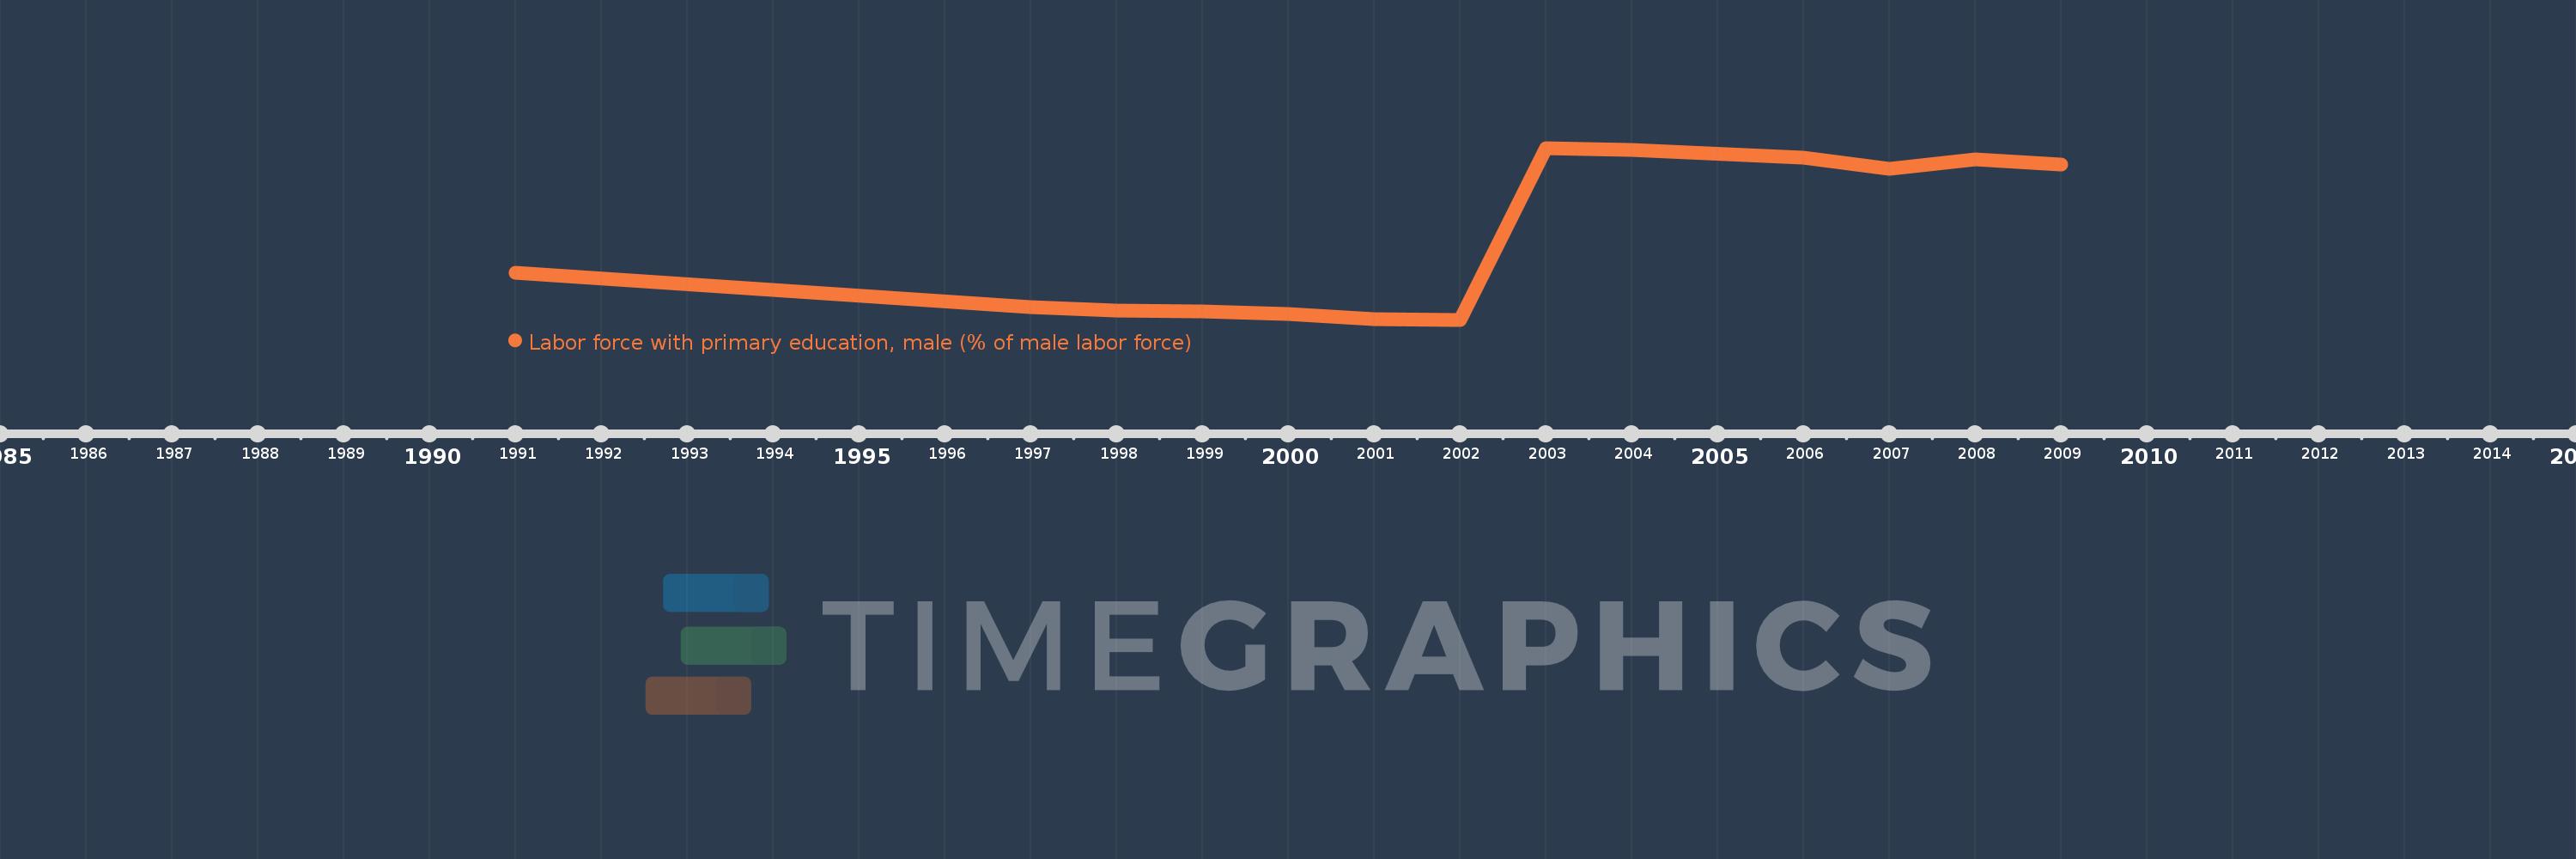
Labor force with primary education, male (% of male labor force)
2009,2008,2007,2006,2004,2003,2002,2001,2000,1999,1998,1997,1991
Queste statistiche in altri paesi:
Linea del tempo:
Questa scala temporale mostra un grafico dal 1991 anno al 2009 anno. Japan. I dati fino ad 1990 anno non disponibili. Il numero di osservazioni attuali secondo i date: 13.
La fonte (nome):
Indicatori dello sviluppo mondiale
La fonte (organizzazione):
International Labour Organization, Key Indicators of the Labour Market database.
Categorie:
Education, Social Protection & Labor, Gender
sono stati aggiornati
23 apr 2017 anni
Indicatori delle variazioni dei valori per anni
Minima:
17.7
1 gen 2002 anni
Massimo:
62.7
1 gen 2003 anni
Alla data di osservazione
Valore
Variazione assoluta
La variazione rispetto al valore precedente
1 gen 1991 anni
29.9
+29.9
0.0%
1 gen 1997 anni
20.9
-9.0
-30.1%
1 gen 1998 anni
20.2
-0.7
-3.35%
1 gen 1999 anni
19.8
-0.4
-1.98%
1 gen 2000 anni
19.3
-0.5
-2.53%
1 gen 2001 anni
17.8
-1.5
-7.77%
1 gen 2002 anni
17.7
-0.1
-0.56%
1 gen 2003 anni
62.7
+45.0
254.24%
1 gen 2004 anni
62.2
-0.5
-0.8%
1 gen 2006 anni
60.1
-2.1
-3.38%
1 gen 2007 anni
57.3
-2.8
-4.66%
1 gen 2008 anni
59.8
+2.5
4.36%
1 gen 2009 anni
58.3
-1.5
-2.51%
Classificazione dei paesi secondo i statistiche attuali per anni


Commenti: