29
/it/
it
AIzaSyAYiBZKx7MnpbEhh9jyipgxe19OcubqV5w
April 1, 2024
162108
Italy
ITA
true
2
1
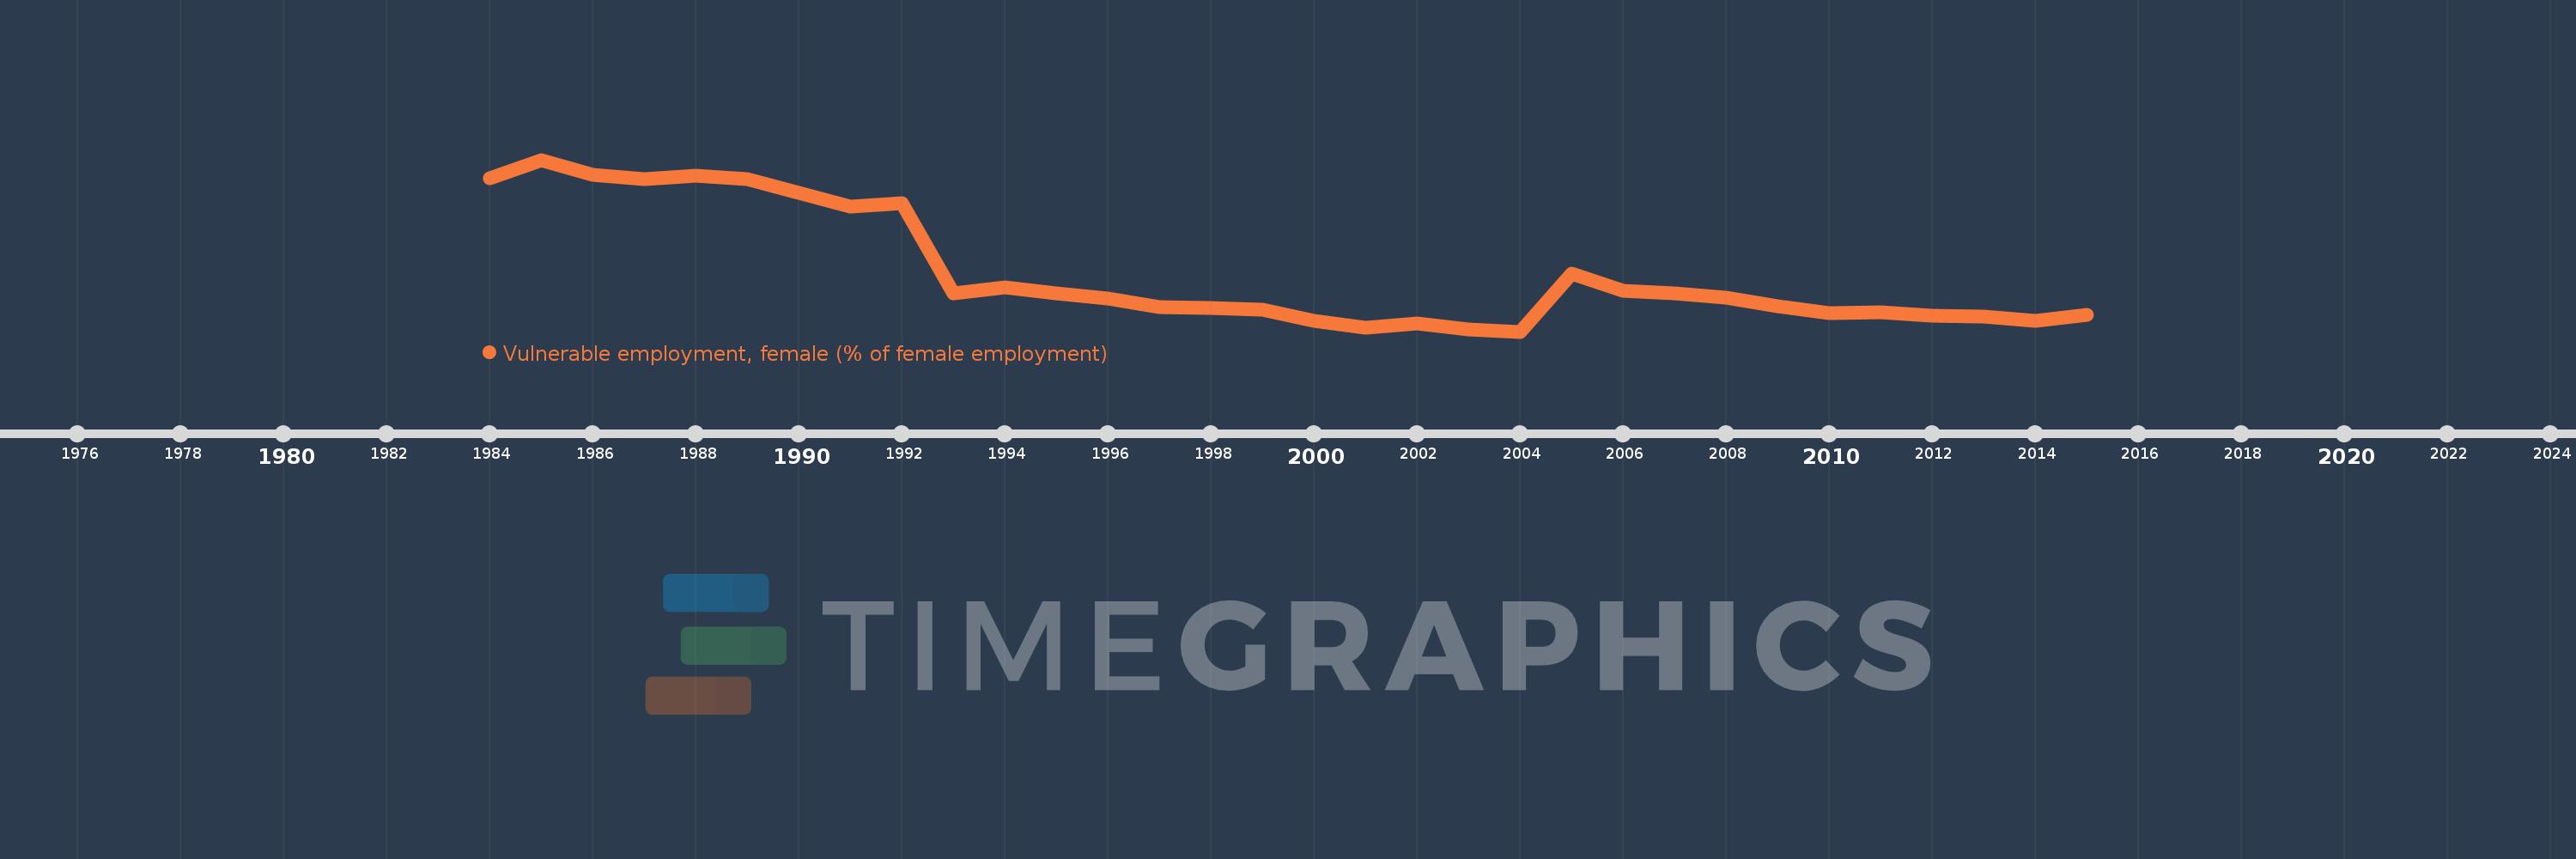
Vulnerable employment, female (% of female employment)
2015,2014,2013,2012,2011,2010,2009,2008,2007,2006,2005,2004,2003,2002,2001,2000,1999,1998,1997,1996,1995,1994,1993,1992,1991,1990,1989,1988,1987,1986,1985,1984
Queste statistiche in altri paesi:
AlbaniaAlgeriaAntigua and BarbudaArgentinaArmeniaArubaAustriaAzerbaijanBahamas, TheBahrainBangladeshBarbadosBelarusBelgiumBelizeBeninBermudaBhutanBoliviaBosnia and HerzegovinaBotswanaBrazilBritish Virgin IslandsBrunei DarussalamBulgariaBurkina FasoBurundiCabo VerdeCambodiaCameroonCaribbean small statesCayman IslandsCentral Europe and the BalticsChadColombiaCongo, Rep.Costa RicaCote d'IvoireCroatiaCyprusCzech RepublicDenmarkDominicaDominican RepublicEarly-demographic dividendEcuadorEgypt, Arab Rep.El SalvadorEquatorial GuineaEstoniaEthiopiaEuro areaEurope & Central AsiaEurope & Central Asia (excluding high income)Europe & Central Asia (IDA & IBRD countries)European UnionFijiFinlandFranceFrench PolynesiaGabonGambia, TheGeorgiaGermanyGhanaGreeceGrenadaGuatemalaGuineaHondurasHong Kong SAR, ChinaHungaryIcelandIndiaIndonesiaIran, Islamic Rep.IrelandItalyJamaicaJordanKazakhstanKenyaKiribatiKosovoKuwaitKyrgyz RepublicLao PDRLatin America & Caribbean Latin America & Caribbean (excluding high income)Latin America & the Caribbean (IDA & IBRD countries)LatviaLebanonLesothoLiberiaLithuaniaLower middle incomeLuxembourgMacao SAR, ChinaMacedonia, FYRMadagascarMalawiMalaysiaMaldivesMaliMaltaMarshall IslandsMauritiusMiddle East & North AfricaMiddle East & North Africa (excluding high income)Middle East & North Africa (IDA & IBRD countries)MoldovaMongoliaMoroccoMozambiqueNamibiaNepalNetherlandsNicaraguaNigerNorwayPakistanPanamaParaguayPeruPhilippinesPolandPortugalQatarRomaniaRussian FederationRwandaSamoaSao Tome and PrincipeSaudi ArabiaSenegalSerbiaSeychellesSierra LeoneSingaporeSlovak RepublicSloveniaSouth AfricaSouth AsiaSouth Asia (IDA & IBRD)SpainSri LankaSt. Kitts and NevisSt. LuciaSt. Vincent and the GrenadinesSurinameSwazilandSwedenSwitzerlandSyrian Arab RepublicTajikistanTanzaniaThailandTimor-LesteTogoTongaTrinidad and TobagoTunisiaTurkeyTuvaluUgandaUkraineUnited Arab EmiratesUnited KingdomUruguayVanuatuVenezuela, RBVietnamWest Bank and GazaYemen, Rep.ZambiaZimbabwe Linea del tempo:
Questa scala temporale mostra un grafico dal 1984 anno al 2015 anno. Italy. I dati fino ad 1983 anno non disponibili. Il numero di osservazioni attuali secondo i date: 32.
La fonte (nome):
Indicatori dello sviluppo mondiale
La fonte (organizzazione):
International Labour Organization, Key Indicators of the Labour Market database.
Categorie:
Social Protection & Labor, Gender, Social Development
sono stati aggiornati
23 apr 2017 anni
Indicatori delle variazioni dei valori per anni
Minima:
13.3
1 gen 2004 anni
Massimo:
27.3
1 gen 1985 anni
Alla data di osservazione
Valore
Variazione assoluta
La variazione rispetto al valore precedente
1 gen 1984 anni
25.8
+25.8
0.0%
1 gen 1985 anni
27.3
+1.5
5.81%
1 gen 1986 anni
26.1
-1.2
-4.4%
1 gen 1987 anni
25.7
-0.4
-1.53%
1 gen 1988 anni
26.0
+0.3
1.17%
1 gen 1989 anni
25.7
-0.3
-1.15%
1 gen 1990 anni
24.6
-1.1
-4.28%
1 gen 1991 anni
23.5
-1.1
-4.47%
1 gen 1992 anni
23.8
+0.3
1.28%
1 gen 1993 anni
16.4
-7.4
-31.09%
1 gen 1994 anni
16.9
+0.5
3.05%
1 gen 1995 anni
16.4
-0.5
-2.96%
1 gen 1996 anni
16.0
-0.4
-2.44%
1 gen 1997 anni
15.3
-0.7
-4.37%
1 gen 1998 anni
15.2
-0.1
-0.65%
1 gen 1999 anni
15.1
-0.1
-0.66%
1 gen 2000 anni
14.2
-0.9
-5.96%
1 gen 2001 anni
13.6
-0.6
-4.23%
1 gen 2002 anni
14.0
+0.4
2.94%
1 gen 2003 anni
13.5
-0.5
-3.57%
1 gen 2004 anni
13.3
-0.2
-1.48%
1 gen 2005 anni
18.0
+4.7
35.34%
1 gen 2006 anni
16.6
-1.4
-7.78%
1 gen 2007 anni
16.4
-0.2
-1.2%
1 gen 2008 anni
16.1
-0.3
-1.83%
1 gen 2009 anni
15.4
-0.7
-4.35%
1 gen 2010 anni
14.8
-0.6
-3.9%
1 gen 2011 anni
14.9
+0.1
0.68%
1 gen 2012 anni
14.6
-0.3
-2.01%
1 gen 2013 anni
14.5
-0.1
-0.68%
1 gen 2014 anni
14.2
-0.3
-2.07%
1 gen 2015 anni
14.7
+0.5
3.52%
Classificazione dei paesi secondo i statistiche attuali per anni


Commenti: