29
/it/
it
AIzaSyAYiBZKx7MnpbEhh9jyipgxe19OcubqV5w
April 1, 2024
159600
Ireland
IRL
true
2
1
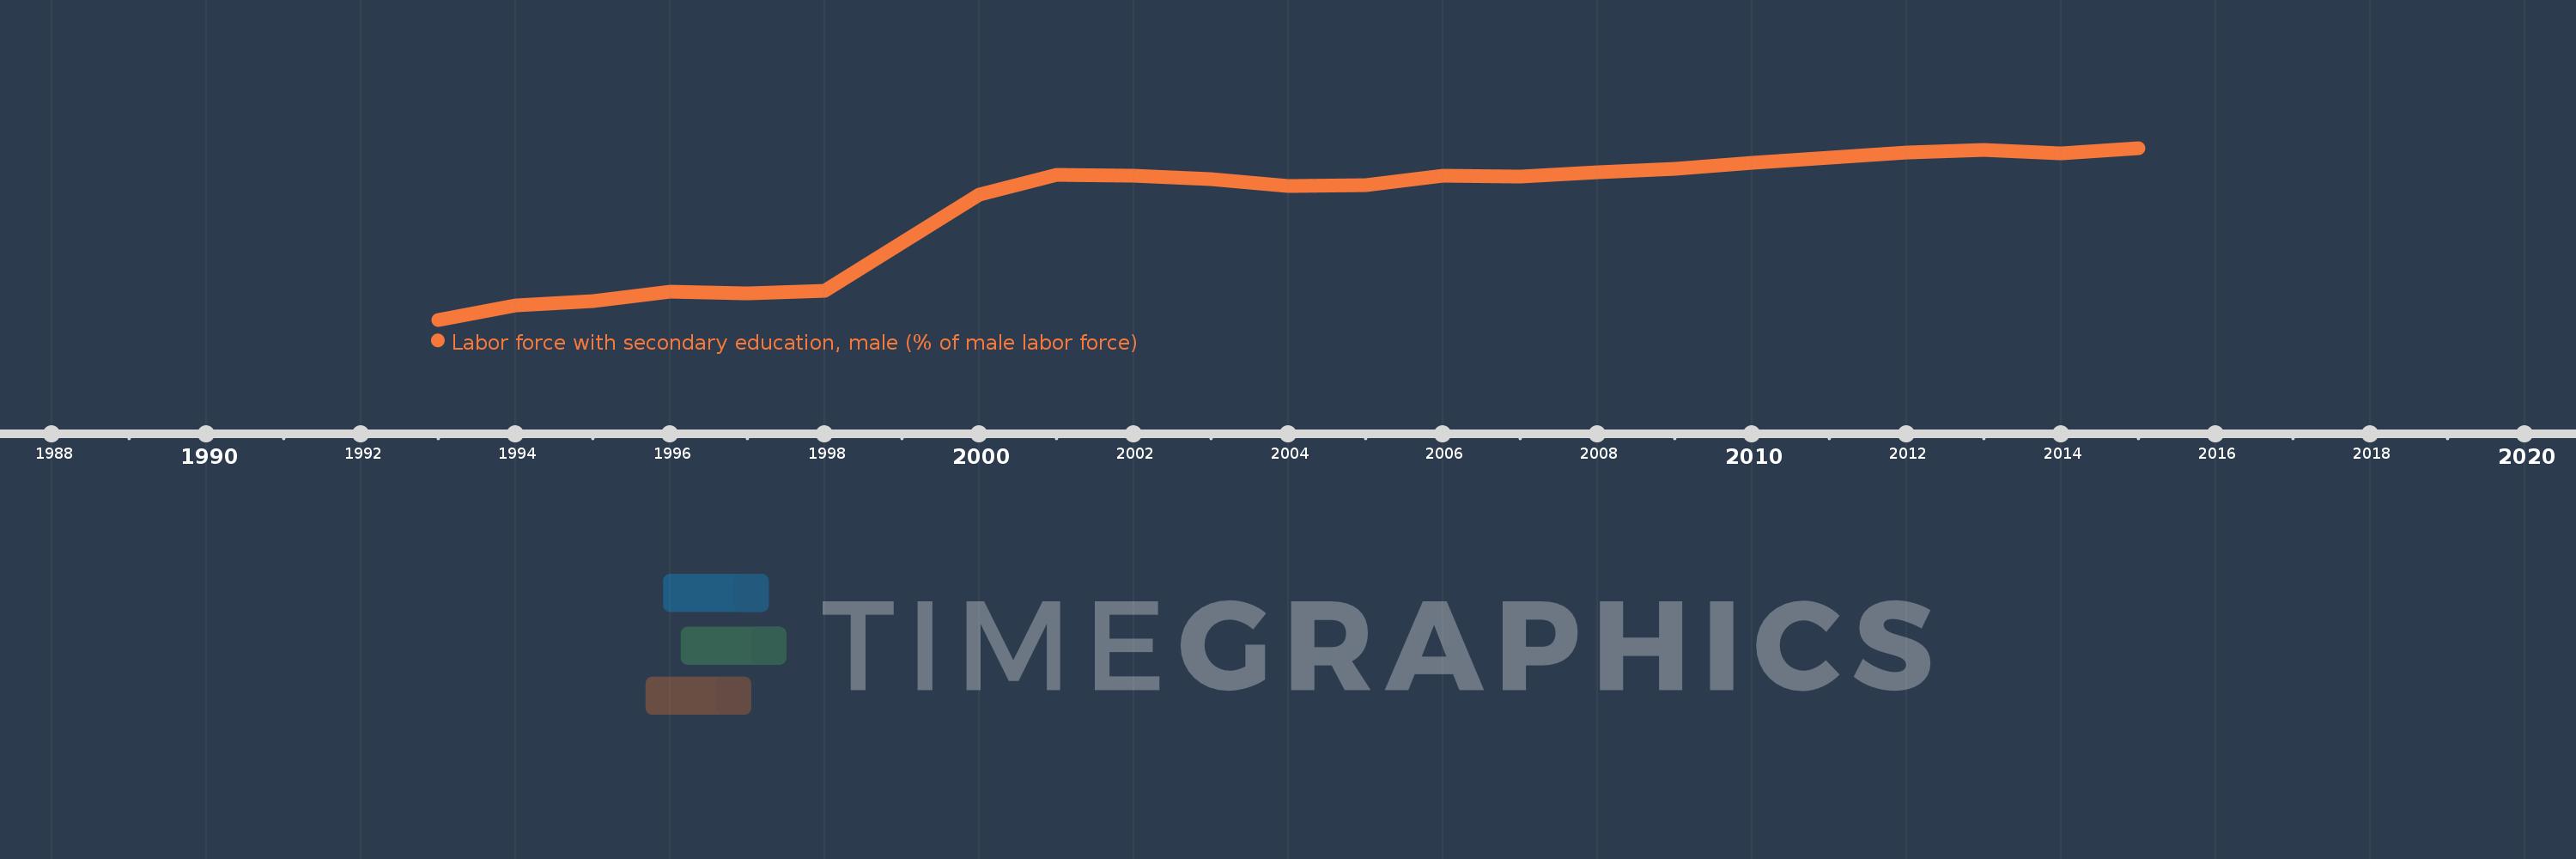
Labor force with secondary education, male (% of male labor force)
2015,2014,2013,2012,2011,2010,2009,2008,2007,2006,2005,2004,2003,2002,2001,2000,1998,1997,1996,1995,1994,1993
Queste statistiche in altri paesi:
Linea del tempo:
Questa scala temporale mostra un grafico dal 1993 anno al 2015 anno. Ireland. I dati fino ad 1992 anno non disponibili. Il numero di osservazioni attuali secondo i date: 22.
La fonte (nome):
Indicatori dello sviluppo mondiale
La fonte (organizzazione):
International Labour Organization, Key Indicators of the Labour Market database.
Categorie:
Education, Social Protection & Labor, Gender
sono stati aggiornati
23 apr 2017 anni
Indicatori delle variazioni dei valori per anni
Minima:
25.0
1 gen 1993 anni
Massimo:
39.8
1 gen 2015 anni
Alla data di osservazione
Valore
Variazione assoluta
La variazione rispetto al valore precedente
1 gen 1993 anni
25.0
+25.0
0.0%
1 gen 1994 anni
26.2
+1.2
4.8%
1 gen 1995 anni
26.6
+0.4
1.53%
1 gen 1996 anni
27.4
+0.8
3.01%
1 gen 1997 anni
27.3
-0.1
-0.36%
1 gen 1998 anni
27.5
+0.2
0.73%
1 gen 2000 anni
35.8
+8.3
30.18%
1 gen 2001 anni
37.5
+1.7
4.75%
1 gen 2002 anni
37.4
-0.1
-0.27%
1 gen 2003 anni
37.1
-0.3
-0.8%
1 gen 2004 anni
36.5
-0.6
-1.62%
1 gen 2005 anni
36.6
+0.1
0.27%
1 gen 2006 anni
37.4
+0.8
2.19%
1 gen 2007 anni
37.3
-0.1
-0.27%
1 gen 2008 anni
37.7
+0.4
1.07%
1 gen 2009 anni
38.0
+0.3
0.8%
1 gen 2010 anni
38.5
+0.5
1.32%
1 gen 2011 anni
39.0
+0.5
1.3%
1 gen 2012 anni
39.4
+0.4
1.03%
1 gen 2013 anni
39.6
+0.2
0.51%
1 gen 2014 anni
39.3
-0.3
-0.76%
1 gen 2015 anni
39.8
+0.5
1.27%
Classificazione dei paesi secondo i statistiche attuali per anni


Commenti: