29
/it/
it
AIzaSyAYiBZKx7MnpbEhh9jyipgxe19OcubqV5w
April 1, 2024
159508
Ireland
IRL
true
2
1
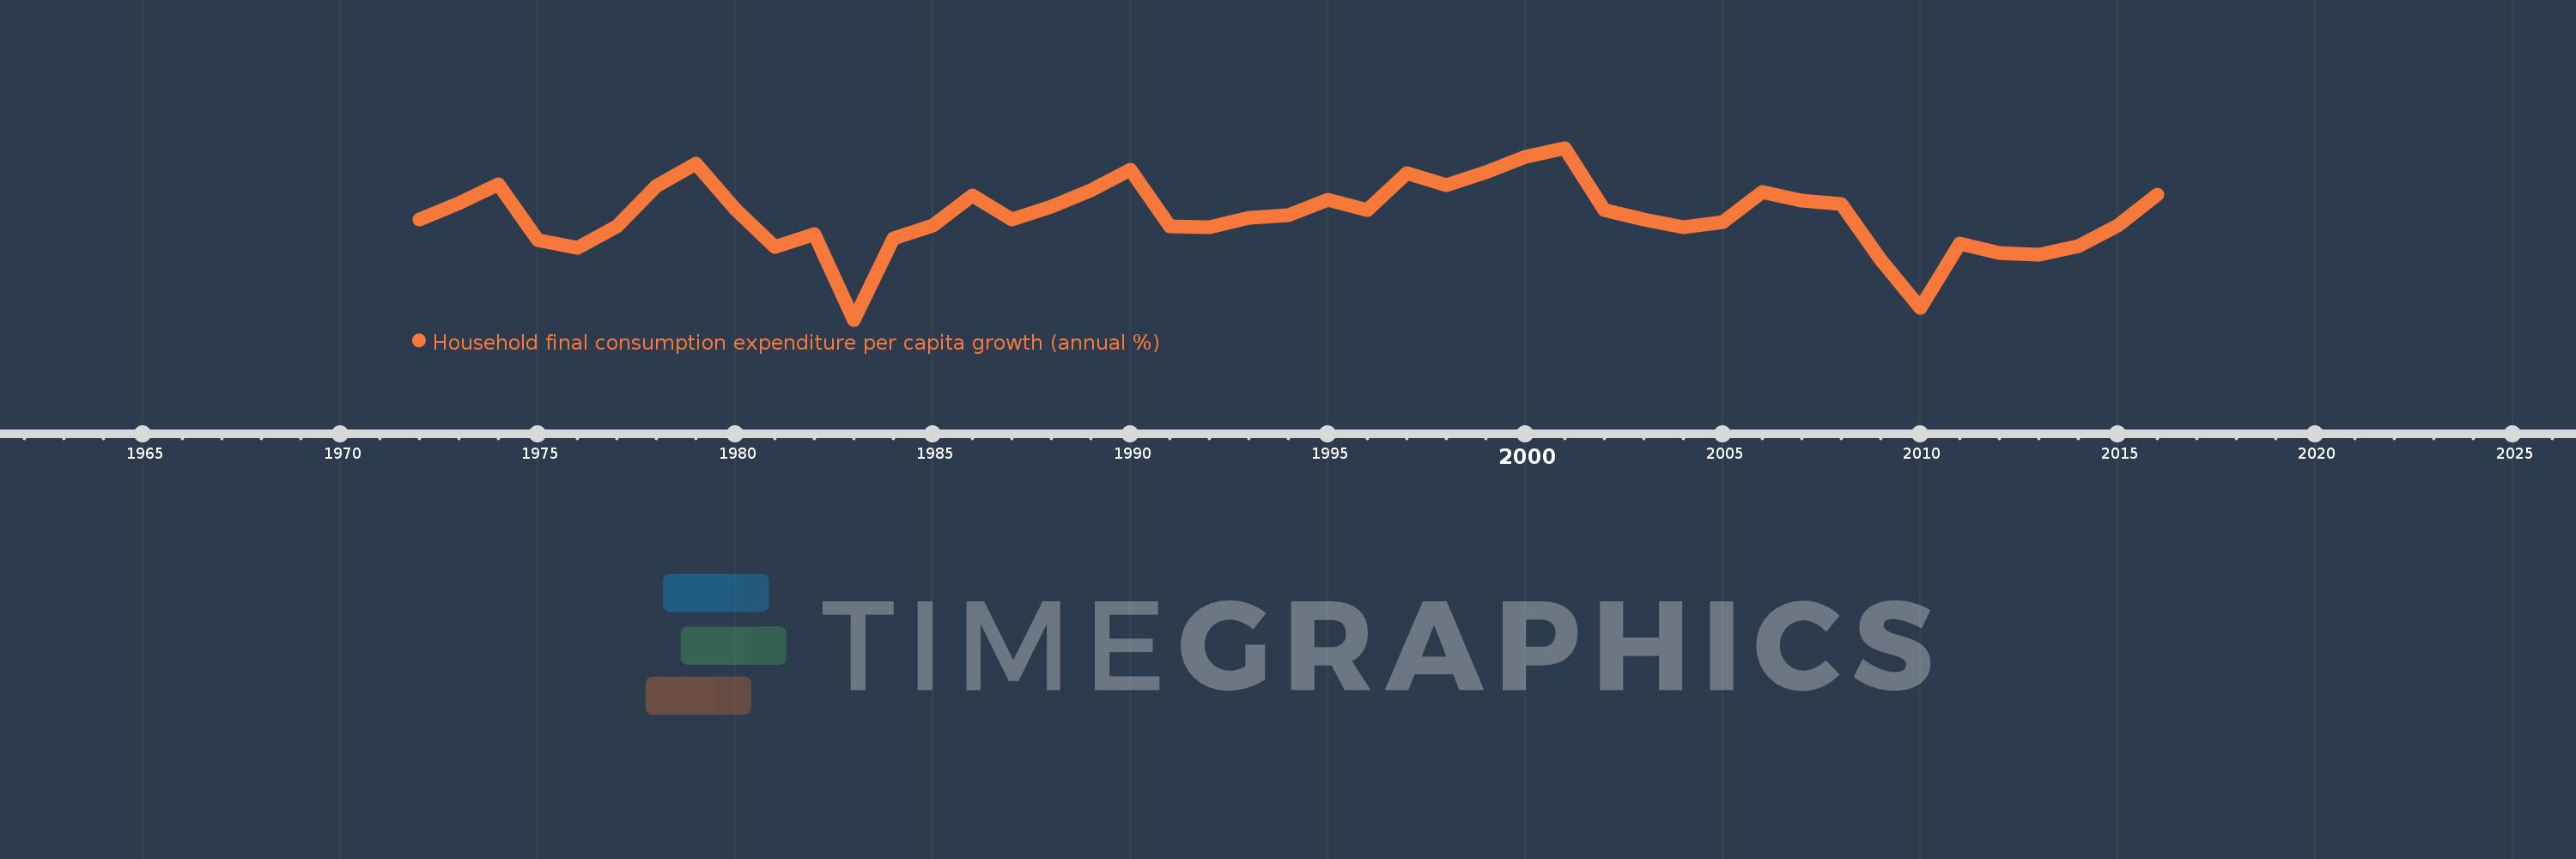
Household final consumption expenditure per capita growth (annual %)
2016,2015,2014,2013,2012,2011,2010,2009,2008,2007,2006,2005,2004,2003,2002,2001,2000,1999,1998,1997,1996,1995,1994,1993,1992,1991,1990,1989,1988,1987,1986,1985,1984,1983,1982,1981,1980,1979,1978,1977,1976,1975,1974,1973,1972
Queste statistiche in altri paesi:
AlbaniaAlgeriaAntigua and BarbudaArab WorldArgentinaArmeniaAustraliaAustriaAzerbaijanBahamas, TheBahrainBangladeshBarbadosBelarusBelgiumBelizeBeninBhutanBoliviaBosnia and HerzegovinaBotswanaBrazilBrunei DarussalamBulgariaBurkina FasoBurundiCabo VerdeCambodiaCameroonCanadaCaribbean small statesCentral Europe and the BalticsChadChileChinaColombiaComorosCongo, Dem. Rep.Congo, Rep.Costa RicaCote d'IvoireCroatiaCubaCyprusCzech RepublicDenmarkDominican RepublicEarly-demographic dividendEast Asia & PacificEast Asia & Pacific (excluding high income)East Asia & Pacific (IDA & IBRD countries)EcuadorEgypt, Arab Rep.El SalvadorEquatorial GuineaEritreaEstoniaEuro areaEurope & Central AsiaEurope & Central Asia (excluding high income)Europe & Central Asia (IDA & IBRD countries)European UnionFinlandFranceGabonGambia, TheGermanyGhanaGreeceGuatemalaGuineaGuinea-BissauHaitiHeavily indebted poor countries (HIPC)High incomeHondurasHong Kong SAR, ChinaHungaryIBRD onlyIcelandIDA & IBRD totalIDA blendIDA onlyIDA totalIndiaIndonesiaIran, Islamic Rep.IrelandIsraelItalyJamaicaJapanJordanKazakhstanKenyaKorea, Rep.KosovoKuwaitKyrgyz RepublicLate-demographic dividendLatin America & Caribbean Latin America & Caribbean (excluding high income)Latin America & the Caribbean (IDA & IBRD countries)LatviaLeast developed countries: UN classificationLebanonLiberiaLithuaniaLow & middle incomeLow incomeLower middle incomeLuxembourgMacao SAR, ChinaMacedonia, FYRMadagascarMalawiMalaysiaMaliMaltaMauritaniaMauritiusMexicoMiddle East & North AfricaMiddle East & North Africa (excluding high income)Middle East & North Africa (IDA & IBRD countries)Middle incomeMoldovaMongoliaMontenegroMoroccoMozambiqueNamibiaNepalNetherlandsNew ZealandNicaraguaNigerNigeriaNorth AmericaNorwayOECD membersOmanOther small statesPakistanPanamaParaguayPeruPhilippinesPolandPortugalPost-demographic dividendPre-demographic dividendPuerto RicoQatarRomaniaRussian FederationRwandaSaudi ArabiaSenegalSerbiaSierra LeoneSingaporeSlovak RepublicSloveniaSmall statesSouth AfricaSouth AsiaSouth Asia (IDA & IBRD)South SudanSpainSri LankaSub-Saharan Africa Sub-Saharan Africa (excluding high income)Sub-Saharan Africa (IDA & IBRD countries)SudanSurinameSwazilandSwedenSwitzerlandTajikistanTanzaniaThailandTimor-LesteTogoTrinidad and TobagoTunisiaTurkeyUgandaUkraineUnited Arab EmiratesUnited KingdomUnited StatesUpper middle incomeUruguayVanuatuVenezuela, RBVietnamWest Bank and GazaWorldZimbabwe Linea del tempo:
Questa scala temporale mostra un grafico dal 1972 anno al 2016 anno. Ireland. I dati fino ad 1971 anno non disponibili. Il numero di osservazioni attuali secondo i date: 45.
La fonte (nome):
Indicatori dello sviluppo mondiale
La fonte (organizzazione):
World Bank national accounts data, and OECD National Accounts data files.
Categorie:
Economy & Growth
sono stati aggiornati
23 apr 2017 anni
Indicatori delle variazioni dei valori per anni
Minima:
-7.932
1 gen 1983 anni
Massimo:
9.096
1 gen 2001 anni
Alla data di osservazione
Valore
Variazione assoluta
La variazione rispetto al valore precedente
1 gen 1972 anni
2.037
+2.037
0.0%
1 gen 1973 anni
3.597
+1.56
76.6%
1 gen 1974 anni
5.473
+1.876
52.14%
1 gen 1975 anni
-0.028
-5.501
-100.51%
1 gen 1976 anni
-0.821
-0.793
2.86 Mille.%
1 gen 1977 anni
1.29
+2.111
-257.09%
1 gen 1978 anni
5.333
+4.044
313.49%
1 gen 1979 anni
7.574
+2.241
42.01%
1 gen 1980 anni
3.052
-4.522
-59.71%
1 gen 1981 anni
-0.72
-3.772
-123.6%
1 gen 1982 anni
0.515
+1.235
-171.46%
1 gen 1983 anni
-7.932
-8.447
-1.64 Mille.%
1 gen 1984 anni
0.139
+8.072
-101.76%
1 gen 1985 anni
1.379
+1.24
889.3%
1 gen 1986 anni
4.424
+3.045
220.74%
1 gen 1987 anni
1.966
-2.458
-55.55%
1 gen 1988 anni
3.314
+1.348
68.53%
1 gen 1989 anni
4.933
+1.619
48.86%
1 gen 1990 anni
6.941
+2.008
40.71%
1 gen 1991 anni
1.328
-5.613
-80.87%
1 gen 1992 anni
1.221
-0.107
-8.04%
1 gen 1993 anni
2.187
+0.966
79.09%
1 gen 1994 anni
2.393
+0.206
9.4%
1 gen 1995 anni
3.953
+1.561
65.22%
1 gen 1996 anni
2.918
-1.036
-26.2%
1 gen 1997 anni
6.616
+3.699
126.76%
1 gen 1998 anni
5.399
-1.218
-18.4%
1 gen 1999 anni
6.69
+1.291
23.91%
1 gen 2000 anni
8.208
+1.518
22.7%
1 gen 2001 anni
9.096
+0.888
10.82%
1 gen 2002 anni
2.98
-6.116
-67.24%
1 gen 2003 anni
1.986
-0.994
-33.34%
1 gen 2004 anni
1.216
-0.77
-38.79%
1 gen 2005 anni
1.755
+0.539
44.33%
1 gen 2006 anni
4.751
+2.997
170.76%
1 gen 2007 anni
3.854
-0.898
-18.9%
1 gen 2008 anni
3.577
-0.277
-7.18%
1 gen 2009 anni
-2.009
-5.586
-156.18%
1 gen 2010 anni
-6.749
-4.74
235.88%
1 gen 2011 anni
-0.373
+6.376
-94.47%
1 gen 2012 anni
-1.291
-0.917
245.78%
1 gen 2013 anni
-1.464
-0.174
13.47%
1 gen 2014 anni
-0.596
+0.869
-59.31%
1 gen 2015 anni
1.374
+1.97
-330.5%
1 gen 2016 anni
4.514
+3.14
228.63%
Classificazione dei paesi secondo i statistiche attuali per anni


Commenti: