29
/it/
it
AIzaSyAYiBZKx7MnpbEhh9jyipgxe19OcubqV5w
April 1, 2024
157670
Iran, Islamic Rep.
IRN
true
2
1
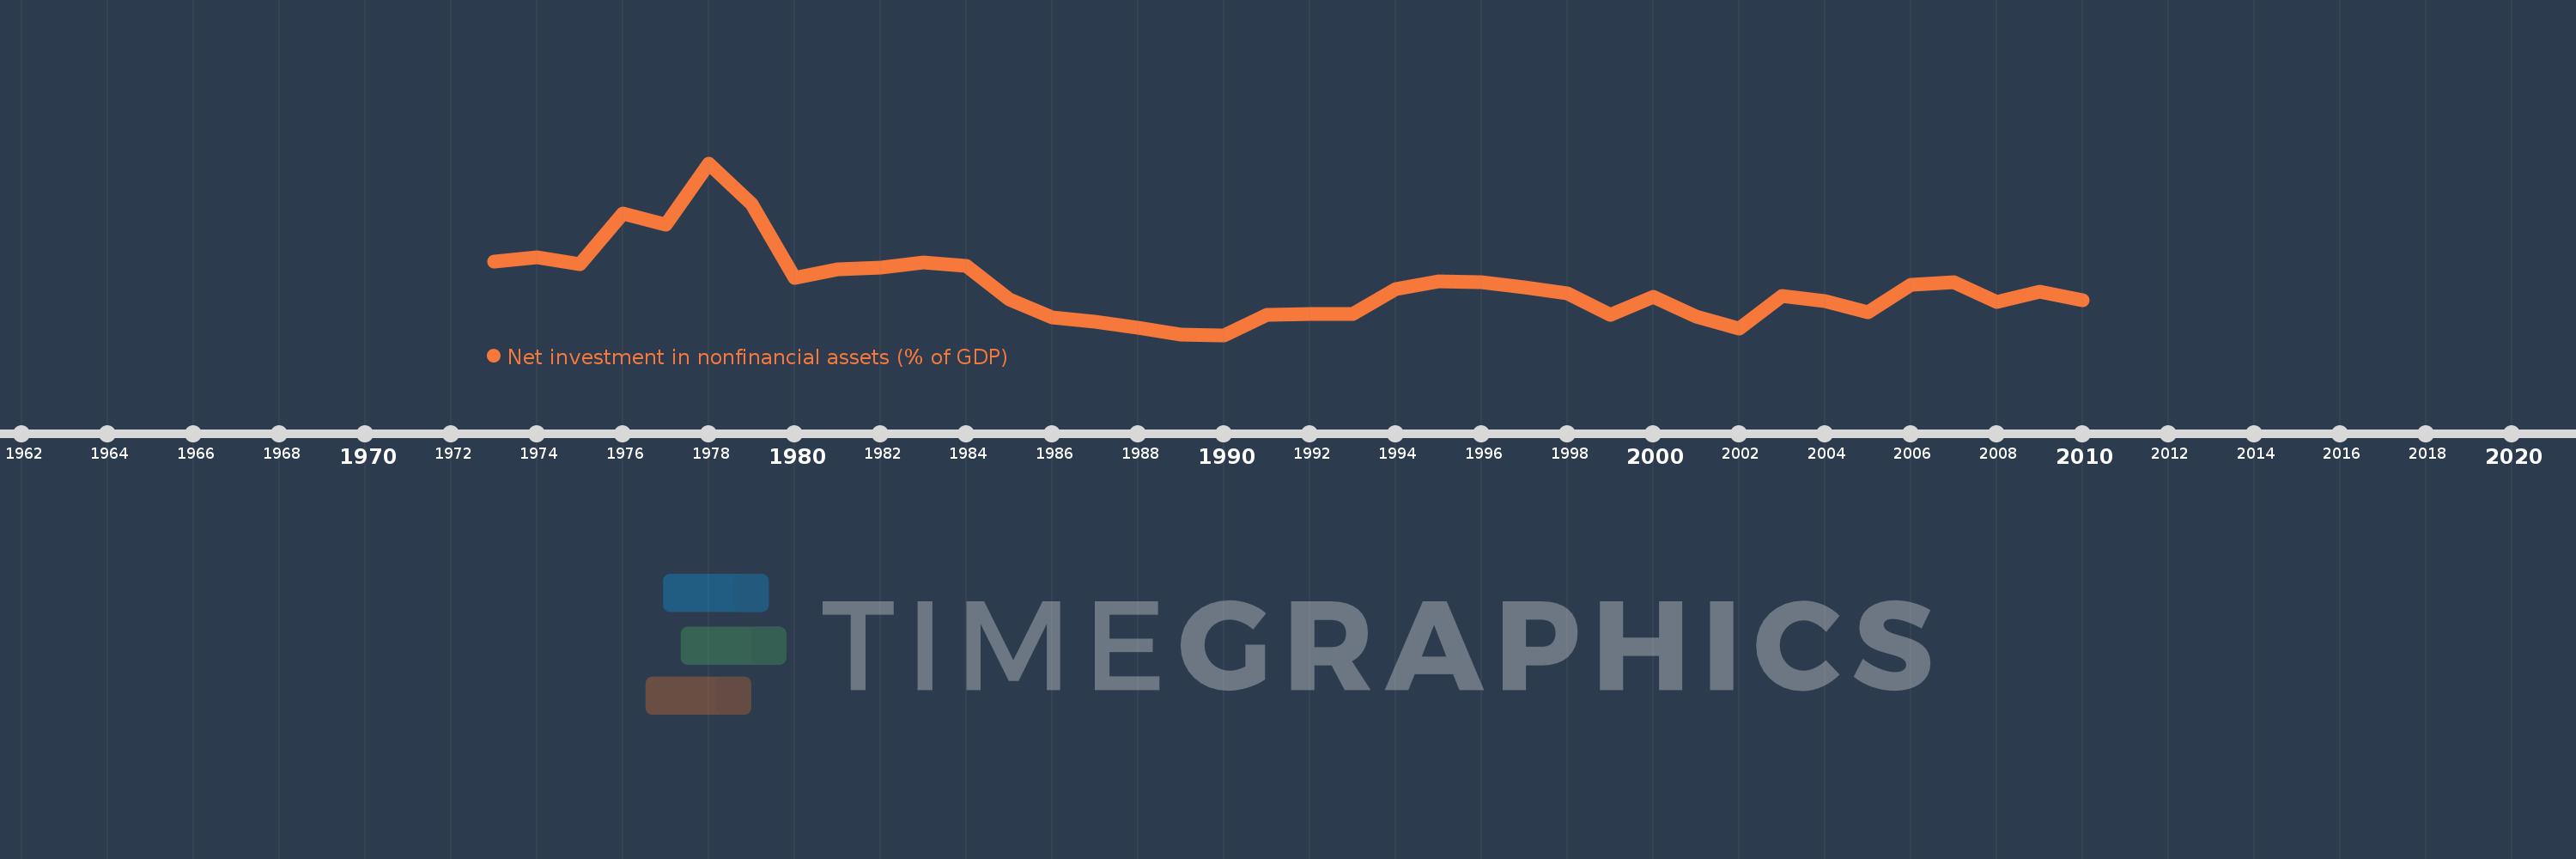
Net investment in nonfinancial assets (% of GDP)
2010,2009,2008,2007,2006,2005,2004,2003,2002,2001,2000,1999,1998,1997,1996,1995,1994,1993,1992,1991,1990,1989,1988,1987,1986,1985,1984,1983,1982,1981,1980,1979,1978,1977,1976,1975,1974,1973
Queste statistiche in altri paesi:
AfghanistanAlbaniaAlgeriaAngolaAntigua and BarbudaArmeniaAustraliaAustriaAzerbaijanBahamas, TheBahrainBangladeshBarbadosBelarusBelgiumBelizeBhutanBoliviaBosnia and HerzegovinaBrazilBurundiCabo VerdeCambodiaCanadaCaribbean small statesCentral African RepublicCentral Europe and the BalticsChileChinaCongo, Dem. Rep.Congo, Rep.Costa RicaCote d'IvoireCroatiaCyprusCzech RepublicDenmarkDominicaDominican RepublicEarly-demographic dividendEast Asia & Pacific (excluding high income)East Asia & Pacific (IDA & IBRD countries)Egypt, Arab Rep.El SalvadorEquatorial GuineaEstoniaEthiopiaEuro areaEurope & Central AsiaEurope & Central Asia (excluding high income)Europe & Central Asia (IDA & IBRD countries)European UnionFijiFinlandFranceGambia, TheGeorgiaGermanyGreeceGuatemalaHigh incomeHondurasHungaryIBRD onlyIcelandIDA & IBRD totalIDA blendIndiaIndonesiaIran, Islamic Rep.IraqIrelandIsraelItalyJamaicaKazakhstanKiribatiKorea, Rep.Kyrgyz RepublicLao PDRLate-demographic dividendLatin America & Caribbean Latin America & Caribbean (excluding high income)Latin America & the Caribbean (IDA & IBRD countries)LatviaLebanonLithuaniaLow & middle incomeLower middle incomeLuxembourgMacao SAR, ChinaMacedonia, FYRMadagascarMalawiMaldivesMaliMaltaMauritiusMexicoMicronesia, Fed. Sts.Middle East & North Africa (excluding high income)Middle East & North Africa (IDA & IBRD countries)Middle incomeMoldovaMongoliaMoroccoMozambiqueNamibiaNepalNetherlandsNew ZealandNicaraguaNigeriaNorth AmericaNorwayOECD membersOmanOther small statesPacific island small statesPakistanParaguayPeruPhilippinesPolandPortugalPost-demographic dividendQatarRomaniaRussian FederationRwandaSamoaSan MarinoSao Tome and PrincipeSenegalSerbiaSierra LeoneSingaporeSlovak RepublicSmall statesSolomon IslandsSouth AfricaSouth AsiaSouth Asia (IDA & IBRD)SpainSri LankaSub-Saharan Africa Sub-Saharan Africa (excluding high income)Sub-Saharan Africa (IDA & IBRD countries)SurinameSwazilandSwedenSwitzerlandSyrian Arab RepublicThailandTimor-LesteTrinidad and TobagoTurkeyUgandaUkraineUnited Arab EmiratesUnited KingdomUnited StatesUpper middle incomeUruguayVanuatuVietnamWest Bank and GazaWorldYemen, Rep.Zimbabwe Linea del tempo:
Questa scala temporale mostra un grafico dal 1973 anno al 2010 anno. Iran, Islamic Rep.. I dati fino ad 1972 anno non disponibili. Il numero di osservazioni attuali secondo i date: 38.
La fonte (nome):
Indicatori dello sviluppo mondiale
La fonte (organizzazione):
International Monetary Fund, Government Finance Statistics Yearbook and data files.
Categorie:
Public Sector
sono stati aggiornati
23 apr 2017 anni
Indicatori delle variazioni dei valori per anni
Minima:
3.085
1 gen 1990 anni
Massimo:
15.199
1 gen 1978 anni
Alla data di osservazione
Valore
Variazione assoluta
La variazione rispetto al valore precedente
1 gen 1973 anni
8.289
+8.289
0.0%
1 gen 1974 anni
8.566
+0.278
3.35%
1 gen 1975 anni
8.106
-0.46
-5.38%
1 gen 1976 anni
11.682
+3.576
44.12%
1 gen 1977 anni
10.854
-0.828
-7.09%
1 gen 1978 anni
15.199
+4.345
40.03%
1 gen 1979 anni
12.318
-2.88
-18.95%
1 gen 1980 anni
7.133
-5.185
-42.09%
1 gen 1981 anni
7.699
+0.566
7.94%
1 gen 1982 anni
7.815
+0.115
1.5%
1 gen 1983 anni
8.188
+0.373
4.78%
1 gen 1984 anni
7.956
-0.232
-2.84%
1 gen 1985 anni
5.579
-2.377
-29.88%
1 gen 1986 anni
4.326
-1.253
-22.46%
1 gen 1987 anni
4.037
-0.288
-6.67%
1 gen 1988 anni
3.604
-0.433
-10.73%
1 gen 1989 anni
3.128
-0.476
-13.22%
1 gen 1990 anni
3.085
-0.043
-1.38%
1 gen 1991 anni
4.519
+1.435
46.52%
1 gen 1992 anni
4.551
+0.032
0.71%
1 gen 1993 anni
4.541
-0.011
-0.24%
1 gen 1994 anni
6.345
+1.804
39.73%
1 gen 1995 anni
6.847
+0.503
7.92%
1 gen 1996 anni
6.832
-0.015
-0.22%
1 gen 1997 anni
6.464
-0.368
-5.39%
1 gen 1998 anni
6.008
-0.456
-7.05%
1 gen 1999 anni
4.493
-1.515
-25.22%
1 gen 2000 anni
5.796
+1.303
29.01%
1 gen 2001 anni
4.383
-1.414
-24.39%
1 gen 2002 anni
3.513
-0.87
-19.84%
1 gen 2003 anni
5.867
+2.354
67.01%
1 gen 2004 anni
5.45
-0.416
-7.1%
1 gen 2005 anni
4.666
-0.784
-14.39%
1 gen 2006 anni
6.616
+1.95
41.8%
1 gen 2007 anni
6.785
+0.169
2.55%
1 gen 2008 anni
5.407
-1.378
-20.31%
1 gen 2009 anni
6.121
+0.715
13.22%
1 gen 2010 anni
5.518
-0.603
-9.86%
Classificazione dei paesi secondo i statistiche attuali per anni


Commenti: