29
/it/
it
AIzaSyAYiBZKx7MnpbEhh9jyipgxe19OcubqV5w
April 1, 2024
157601
Iran, Islamic Rep.
IRN
true
2
1
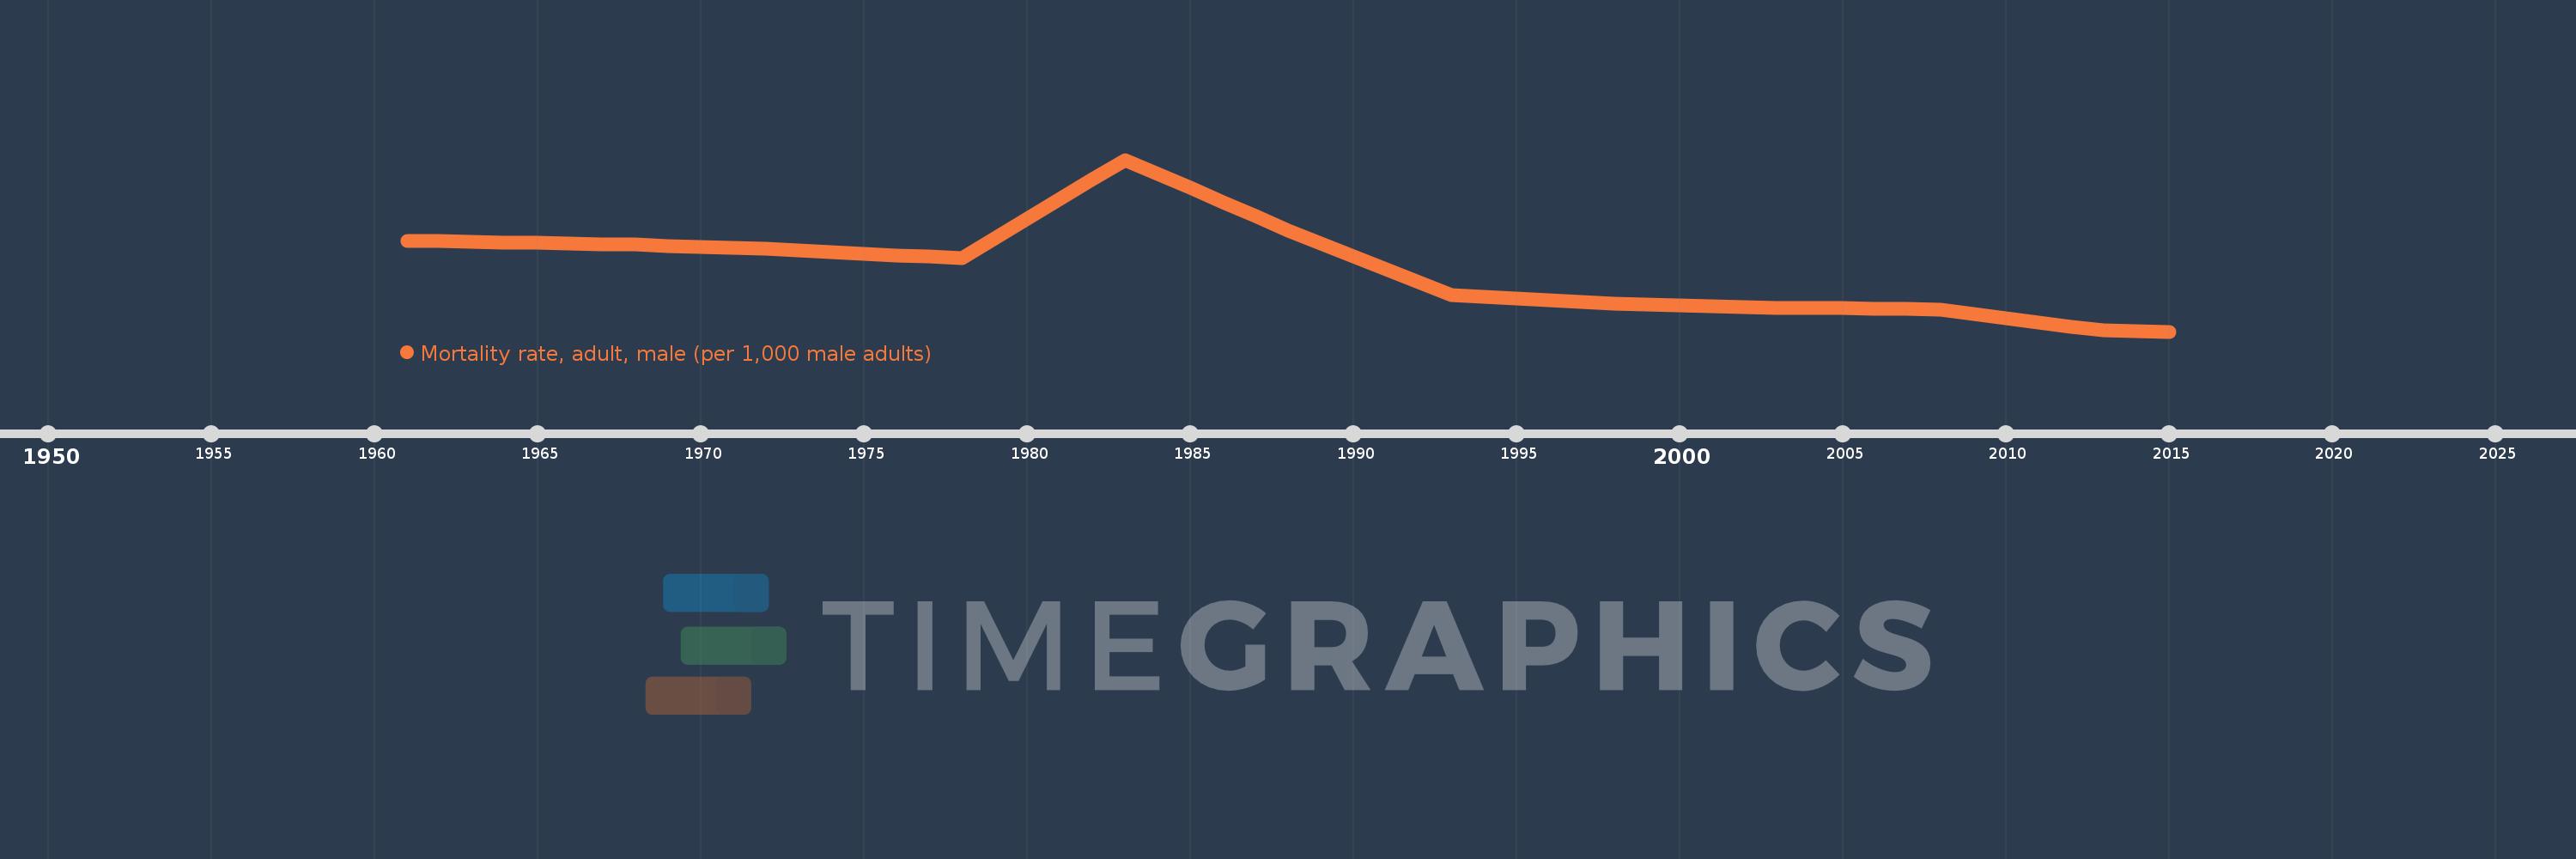
Mortality rate, adult, male (per 1,000 male adults)
2015,2014,2013,2012,2011,2010,2009,2008,2007,2006,2005,2004,2003,2002,2001,2000,1999,1998,1997,1996,1995,1994,1993,1992,1991,1990,1989,1988,1987,1986,1985,1984,1983,1982,1981,1980,1979,1978,1977,1976,1975,1974,1973,1972,1971,1970,1969,1968,1967,1966,1965,1964,1963,1962,1961
Queste statistiche in altri paesi:
AfghanistanAlbaniaAlgeriaAngolaAntigua and BarbudaArab WorldArgentinaArmeniaArubaAustraliaAustriaAzerbaijanBahamas, TheBahrainBangladeshBarbadosBelarusBelgiumBelizeBeninBhutanBoliviaBosnia and HerzegovinaBotswanaBrazilBrunei DarussalamBulgariaBurkina FasoBurundiCabo VerdeCambodiaCameroonCanadaCaribbean small statesCentral African RepublicCentral Europe and the BalticsChadChannel IslandsChileChinaColombiaComorosCongo, Dem. Rep.Congo, Rep.Costa RicaCote d'IvoireCroatiaCubaCuracaoCyprusCzech RepublicDenmarkDjiboutiDominicaDominican RepublicEarly-demographic dividendEast Asia & PacificEast Asia & Pacific (excluding high income)East Asia & Pacific (IDA & IBRD countries)EcuadorEgypt, Arab Rep.El SalvadorEquatorial GuineaEritreaEstoniaEthiopiaEuro areaEurope & Central AsiaEurope & Central Asia (excluding high income)Europe & Central Asia (IDA & IBRD countries)European UnionFijiFinlandFragile and conflict affected situationsFranceFrench PolynesiaGabonGambia, TheGeorgiaGermanyGhanaGreeceGreenlandGrenadaGuamGuatemalaGuineaGuinea-BissauGuyanaHaitiHeavily indebted poor countries (HIPC)High incomeHondurasHong Kong SAR, ChinaHungaryIBRD onlyIcelandIDA & IBRD totalIDA blendIDA onlyIDA totalIndiaIndonesiaIran, Islamic Rep.IraqIrelandIsraelItalyJamaicaJapanJordanKazakhstanKenyaKiribatiKorea, Dem. People’s Rep.Korea, Rep.KuwaitKyrgyz RepublicLao PDRLate-demographic dividendLatin America & Caribbean Latin America & Caribbean (excluding high income)Latin America & the Caribbean (IDA & IBRD countries)LatviaLeast developed countries: UN classificationLebanonLesothoLiberiaLibyaLithuaniaLow & middle incomeLow incomeLower middle incomeLuxembourgMacao SAR, ChinaMacedonia, FYRMadagascarMalawiMalaysiaMaldivesMaliMaltaMarshall IslandsMauritaniaMauritiusMexicoMicronesia, Fed. Sts.Middle East & North AfricaMiddle East & North Africa (excluding high income)Middle East & North Africa (IDA & IBRD countries)Middle incomeMoldovaMongoliaMontenegroMoroccoMozambiqueMyanmarNamibiaNepalNetherlandsNew CaledoniaNew ZealandNicaraguaNigerNigeriaNorth AmericaNorwayOECD membersOmanOther small statesPacific island small statesPakistanPanamaPapua New GuineaParaguayPeruPhilippinesPolandPortugalPost-demographic dividendPre-demographic dividendPuerto RicoQatarRomaniaRussian FederationRwandaSamoaSao Tome and PrincipeSaudi ArabiaSenegalSerbiaSeychellesSierra LeoneSingaporeSlovak RepublicSloveniaSmall statesSolomon IslandsSomaliaSouth AfricaSouth AsiaSouth Asia (IDA & IBRD)South SudanSpainSri LankaSt. Kitts and NevisSt. LuciaSt. Vincent and the GrenadinesSub-Saharan Africa Sub-Saharan Africa (excluding high income)Sub-Saharan Africa (IDA & IBRD countries)SudanSurinameSwazilandSwedenSwitzerlandSyrian Arab RepublicTajikistanTanzaniaThailandTimor-LesteTogoTongaTrinidad and TobagoTunisiaTurkeyTurkmenistanUgandaUkraineUnited Arab EmiratesUnited KingdomUnited StatesUpper middle incomeUruguayUzbekistanVanuatuVenezuela, RBVietnamVirgin Islands (U.S.)West Bank and GazaWorldYemen, Rep.ZambiaZimbabwe Linea del tempo:
Questa scala temporale mostra un grafico dal 1961 anno al 2015 anno. Iran, Islamic Rep.. I dati fino ad 1960 anno non disponibili. Il numero di osservazioni attuali secondo i date: 55.
La fonte (nome):
Indicatori dello sviluppo mondiale
La fonte (organizzazione):
(1) United Nations Population Division. World Population Prospects. New York, United Nations, Department of Economic and Social Affairs (advanced Excel tables). Available at http://esa.un.org/wpp/unpp/panel_population.htm, (2) University of California, Berkeley, and Max Planck Institute for Demographic Research. Human Mortality Database. [ www.mortality.org or www.humanmortality.de].
Categorie:
Health, Gender
sono stati aggiornati
23 apr 2017 anni
Indicatori delle variazioni dei valori per anni
Minima:
105.007
1 gen 2015 anni
Massimo:
585.951
1 gen 1983 anni
Alla data di osservazione
Valore
Variazione assoluta
La variazione rispetto al valore precedente
1 gen 1961 anni
359.061
+359.061
0.0%
1 gen 1962 anni
357.53
-1.531
-0.43%
1 gen 1963 anni
355.999
-1.531
-0.43%
1 gen 1964 anni
354.435
-1.564
-0.44%
1 gen 1965 anni
352.871
-1.564
-0.44%
1 gen 1966 anni
351.307
-1.564
-0.44%
1 gen 1967 anni
349.743
-1.564
-0.45%
1 gen 1968 anni
348.179
-1.564
-0.45%
1 gen 1969 anni
345.11
-3.069
-0.88%
1 gen 1970 anni
342.041
-3.069
-0.89%
1 gen 1971 anni
338.972
-3.069
-0.9%
1 gen 1972 anni
335.903
-3.069
-0.91%
1 gen 1973 anni
332.834
-3.069
-0.91%
1 gen 1974 anni
328.221
-4.613
-1.39%
1 gen 1975 anni
323.607
-4.614
-1.41%
1 gen 1976 anni
318.994
-4.613
-1.43%
1 gen 1977 anni
314.381
-4.613
-1.45%
1 gen 1978 anni
309.767
-4.614
-1.47%
1 gen 1979 anni
365.004
+55.237
17.83%
1 gen 1980 anni
420.241
+55.237
15.13%
1 gen 1981 anni
475.478
+55.237
13.14%
1 gen 1982 anni
530.714
+55.236
11.62%
1 gen 1983 anni
585.951
+55.237
10.41%
1 gen 1984 anni
546.397
-39.554
-6.75%
1 gen 1985 anni
506.843
-39.554
-7.24%
1 gen 1986 anni
467.289
-39.554
-7.8%
1 gen 1987 anni
427.735
-39.554
-8.46%
1 gen 1988 anni
388.181
-39.554
-9.25%
1 gen 1989 anni
351.776
-36.405
-9.38%
1 gen 1990 anni
315.371
-36.405
-10.35%
1 gen 1991 anni
278.966
-36.405
-11.54%
1 gen 1992 anni
242.56
-36.406
-13.05%
1 gen 1993 anni
206.155
-36.405
-15.01%
1 gen 1994 anni
201.793
-4.362
-2.12%
1 gen 1995 anni
197.431
-4.362
-2.16%
1 gen 1996 anni
193.069
-4.362
-2.21%
1 gen 1997 anni
188.707
-4.362
-2.26%
1 gen 1998 anni
184.345
-4.362
-2.31%
1 gen 1999 anni
181.922
-2.423
-1.31%
1 gen 2000 anni
179.499
-2.423
-1.33%
1 gen 2001 anni
177.077
-2.422
-1.35%
1 gen 2002 anni
174.654
-2.423
-1.37%
1 gen 2003 anni
172.231
-2.423
-1.39%
1 gen 2004 anni
171.122
-1.109
-0.64%
1 gen 2005 anni
170.013
-1.109
-0.65%
1 gen 2006 anni
168.903
-1.11
-0.65%
1 gen 2007 anni
167.794
-1.109
-0.66%
1 gen 2008 anni
166.685
-1.109
-0.66%
1 gen 2009 anni
154.867
-11.818
-7.09%
1 gen 2010 anni
143.049
-11.818
-7.63%
1 gen 2011 anni
131.23
-11.819
-8.26%
1 gen 2012 anni
119.412
-11.818
-9.01%
1 gen 2013 anni
107.594
-11.818
-9.9%
1 gen 2014 anni
106.3
-1.294
-1.2%
1 gen 2015 anni
105.007
-1.293
-1.22%
Classificazione dei paesi secondo i statistiche attuali per anni


Commenti: