29
/it/
it
AIzaSyAYiBZKx7MnpbEhh9jyipgxe19OcubqV5w
April 1, 2024
156786
Indonesia
IDN
true
2
1
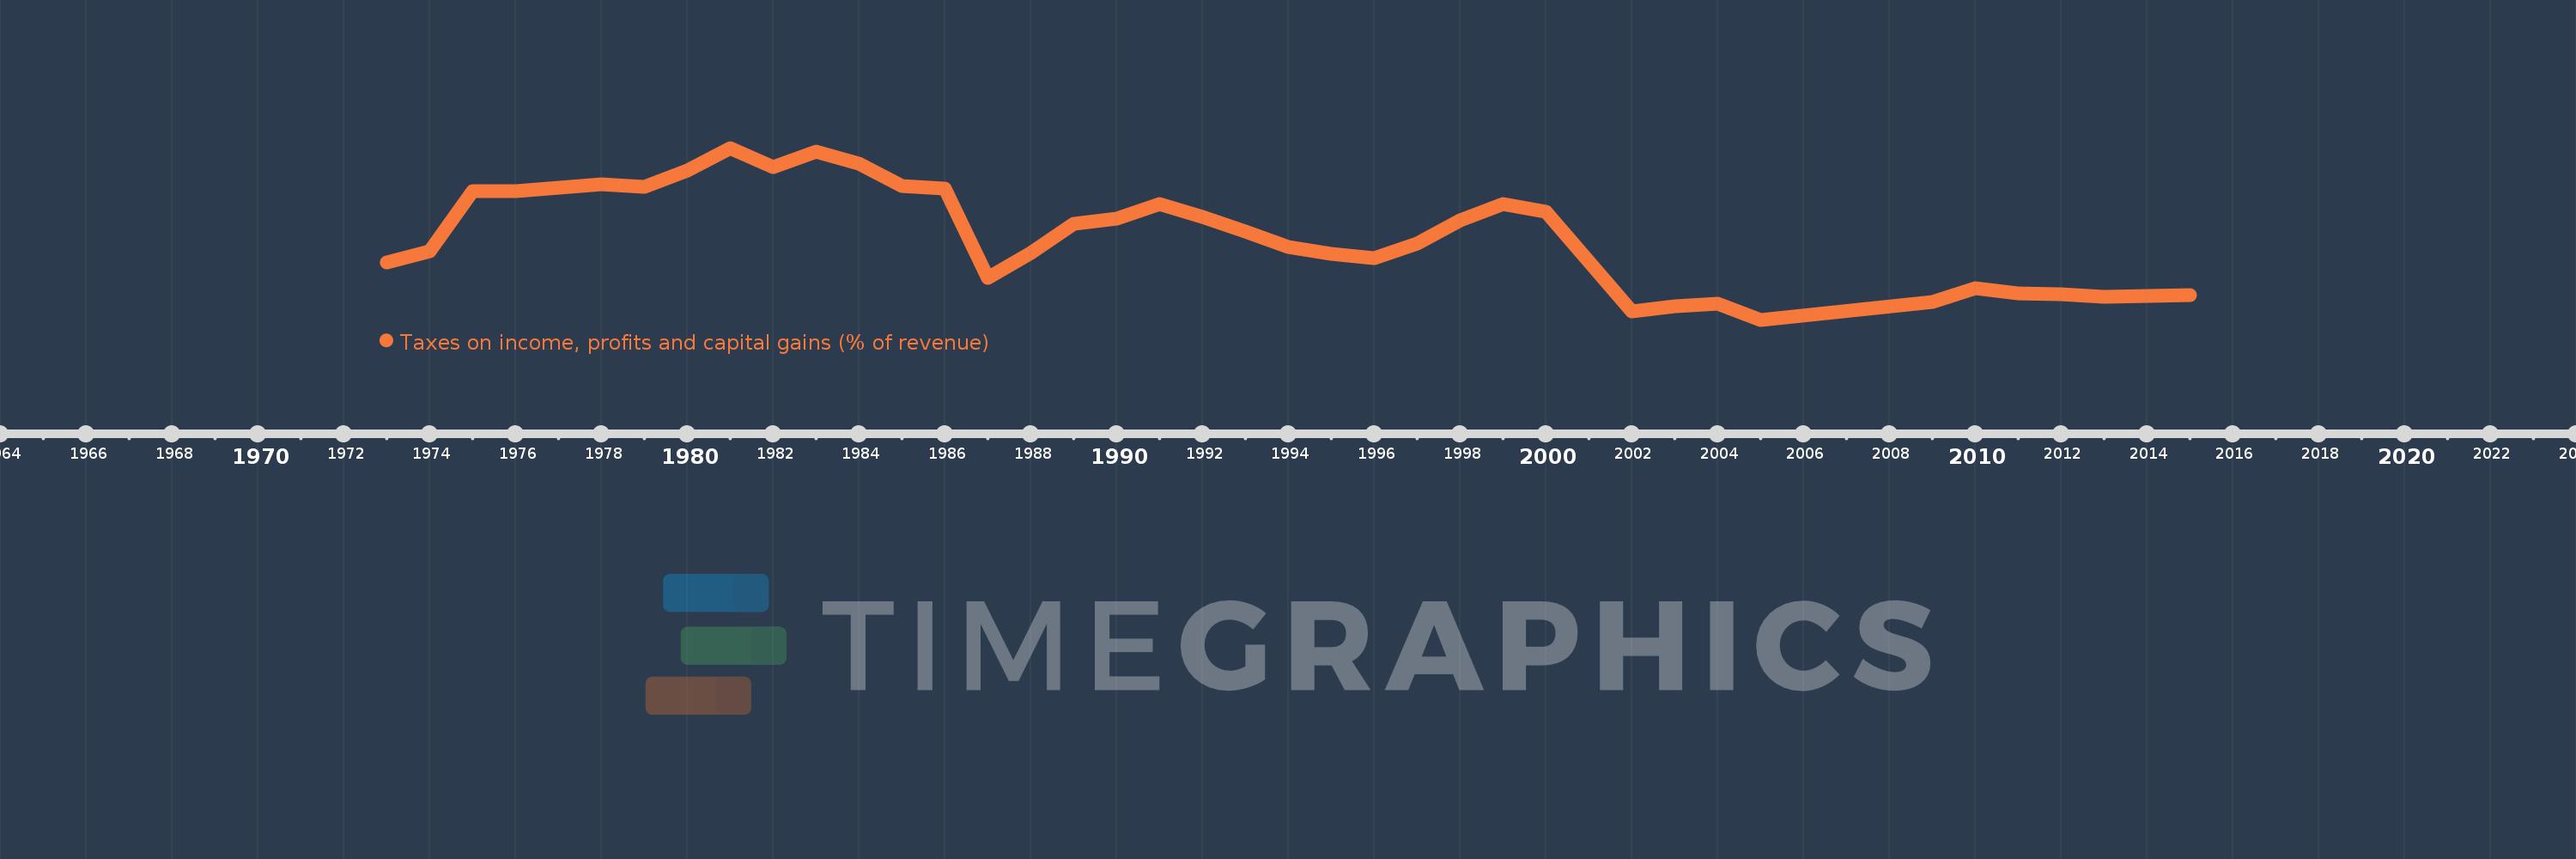
Taxes on income, profits and capital gains (% of revenue)
2015,2014,2013,2012,2011,2010,2009,2005,2004,2003,2002,2000,1999,1998,1997,1996,1995,1994,1993,1992,1991,1990,1989,1988,1987,1986,1985,1984,1983,1982,1981,1980,1979,1978,1977,1976,1975,1974,1973
Queste statistiche in altri paesi:
AfghanistanAlbaniaAlgeriaAngolaAntigua and BarbudaArab WorldArgentinaArmeniaAustraliaAustriaAzerbaijanBahrainBangladeshBarbadosBelarusBelgiumBelizeBeninBhutanBoliviaBosnia and HerzegovinaBotswanaBrazilBulgariaBurkina FasoBurundiCabo VerdeCambodiaCanadaCaribbean small statesCentral African RepublicCentral Europe and the BalticsChileChinaColombiaCongo, Dem. Rep.Congo, Rep.Costa RicaCote d'IvoireCroatiaCyprusCzech RepublicDenmarkDominicaDominican RepublicEarly-demographic dividendEast Asia & PacificEast Asia & Pacific (excluding high income)East Asia & Pacific (IDA & IBRD countries)Egypt, Arab Rep.El SalvadorEquatorial GuineaEstoniaEthiopiaEuro areaEurope & Central AsiaEurope & Central Asia (excluding high income)Europe & Central Asia (IDA & IBRD countries)European UnionFijiFinlandFranceGambia, TheGeorgiaGermanyGhanaGreeceGrenadaGuatemalaHeavily indebted poor countries (HIPC)High incomeHondurasHong Kong SAR, ChinaHungaryIBRD onlyIcelandIDA & IBRD totalIDA blendIDA onlyIDA totalIndiaIndonesiaIran, Islamic Rep.IraqIrelandIsraelItalyJamaicaJapanJordanKazakhstanKenyaKiribatiKorea, Rep.KuwaitKyrgyz RepublicLao PDRLate-demographic dividendLatin America & Caribbean Latin America & Caribbean (excluding high income)Latin America & the Caribbean (IDA & IBRD countries)LatviaLeast developed countries: UN classificationLebanonLesothoLiberiaLithuaniaLow & middle incomeLow incomeLower middle incomeLuxembourgMacao SAR, ChinaMacedonia, FYRMadagascarMalawiMalaysiaMaldivesMaliMaltaMauritiusMexicoMicronesia, Fed. Sts.Middle East & North AfricaMiddle East & North Africa (excluding high income)Middle East & North Africa (IDA & IBRD countries)Middle incomeMoldovaMongoliaMoroccoMozambiqueMyanmarNamibiaNepalNetherlandsNew ZealandNicaraguaNigeriaNorth AmericaNorwayOECD membersOmanOther small statesPakistanPanamaPapua New GuineaParaguayPeruPhilippinesPolandPortugalPost-demographic dividendPre-demographic dividendQatarRomaniaRussian FederationRwandaSamoaSan MarinoSao Tome and PrincipeSenegalSerbiaSeychellesSierra LeoneSingaporeSlovak RepublicSloveniaSmall statesSolomon IslandsSouth AfricaSouth AsiaSouth Asia (IDA & IBRD)SpainSri LankaSt. Kitts and NevisSt. LuciaSub-Saharan Africa Sub-Saharan Africa (excluding high income)Sub-Saharan Africa (IDA & IBRD countries)SurinameSwazilandSwedenSwitzerlandSyrian Arab RepublicTajikistanTanzaniaThailandTimor-LesteTogoTrinidad and TobagoTunisiaTurkeyUgandaUkraineUnited KingdomUnited StatesUpper middle incomeUruguayVenezuela, RBVietnamWest Bank and GazaWorldYemen, Rep.ZambiaZimbabwe Linea del tempo:
Questa scala temporale mostra un grafico dal 1973 anno al 2015 anno. Indonesia. I dati fino ad 1972 anno non disponibili. Il numero di osservazioni attuali secondo i date: 39.
La fonte (nome):
Indicatori dello sviluppo mondiale
La fonte (organizzazione):
International Monetary Fund, Government Finance Statistics Yearbook and data files.
Categorie:
Public Sector
sono stati aggiornati
23 apr 2017 anni
Indicatori delle variazioni dei valori per anni
Minima:
28.186
1 gen 2005 anni
Massimo:
78.013
1 gen 1981 anni
Alla data di osservazione
Valore
Variazione assoluta
La variazione rispetto al valore precedente
1 gen 1973 anni
44.876
+44.876
0.0%
1 gen 1974 anni
48.137
+3.261
7.27%
1 gen 1975 anni
65.466
+17.329
36.0%
1 gen 1976 anni
65.522
+0.055
0.08%
1 gen 1977 anni
66.509
+0.988
1.51%
1 gen 1978 anni
67.391
+0.882
1.33%
1 gen 1979 anni
66.697
-0.694
-1.03%
1 gen 1980 anni
71.461
+4.764
7.14%
1 gen 1981 anni
78.013
+6.552
9.17%
1 gen 1982 anni
72.47
-5.543
-7.11%
1 gen 1983 anni
76.886
+4.417
6.09%
1 gen 1984 anni
73.574
-3.313
-4.31%
1 gen 1985 anni
67.032
-6.542
-8.89%
1 gen 1986 anni
66.138
-0.894
-1.33%
1 gen 1987 anni
40.368
-25.77
-38.96%
1 gen 1988 anni
47.569
+7.201
17.84%
1 gen 1989 anni
55.949
+8.38
17.62%
1 gen 1990 anni
57.54
+1.591
2.84%
1 gen 1991 anni
61.838
+4.298
7.47%
1 gen 1992 anni
58.043
-3.795
-6.14%
1 gen 1993 anni
53.871
-4.172
-7.19%
1 gen 1994 anni
49.329
-4.542
-8.43%
1 gen 1995 anni
47.358
-1.971
-4.0%
1 gen 1996 anni
46.108
-1.25
-2.64%
1 gen 1997 anni
50.248
+4.14
8.98%
1 gen 1998 anni
57.047
+6.799
13.53%
1 gen 1999 anni
61.833
+4.786
8.39%
1 gen 2000 anni
59.495
-2.337
-3.78%
1 gen 2002 anni
30.68
-28.815
-48.43%
1 gen 2003 anni
32.055
+1.375
4.48%
1 gen 2004 anni
32.927
+0.872
2.72%
1 gen 2005 anni
28.186
-4.741
-14.4%
1 gen 2009 anni
33.301
+5.115
18.15%
1 gen 2010 anni
37.422
+4.121
12.38%
1 gen 2011 anni
35.884
-1.538
-4.11%
1 gen 2012 anni
35.616
-0.268
-0.75%
1 gen 2013 anni
34.759
-0.857
-2.41%
1 gen 2014 anni
35.201
+0.442
1.27%
1 gen 2015 anni
35.252
+0.05
0.14%
Classificazione dei paesi secondo i statistiche attuali per anni


Commenti: