29
/it/
it
AIzaSyAYiBZKx7MnpbEhh9jyipgxe19OcubqV5w
April 1, 2024
156353
Indonesia
IDN
true
2
1
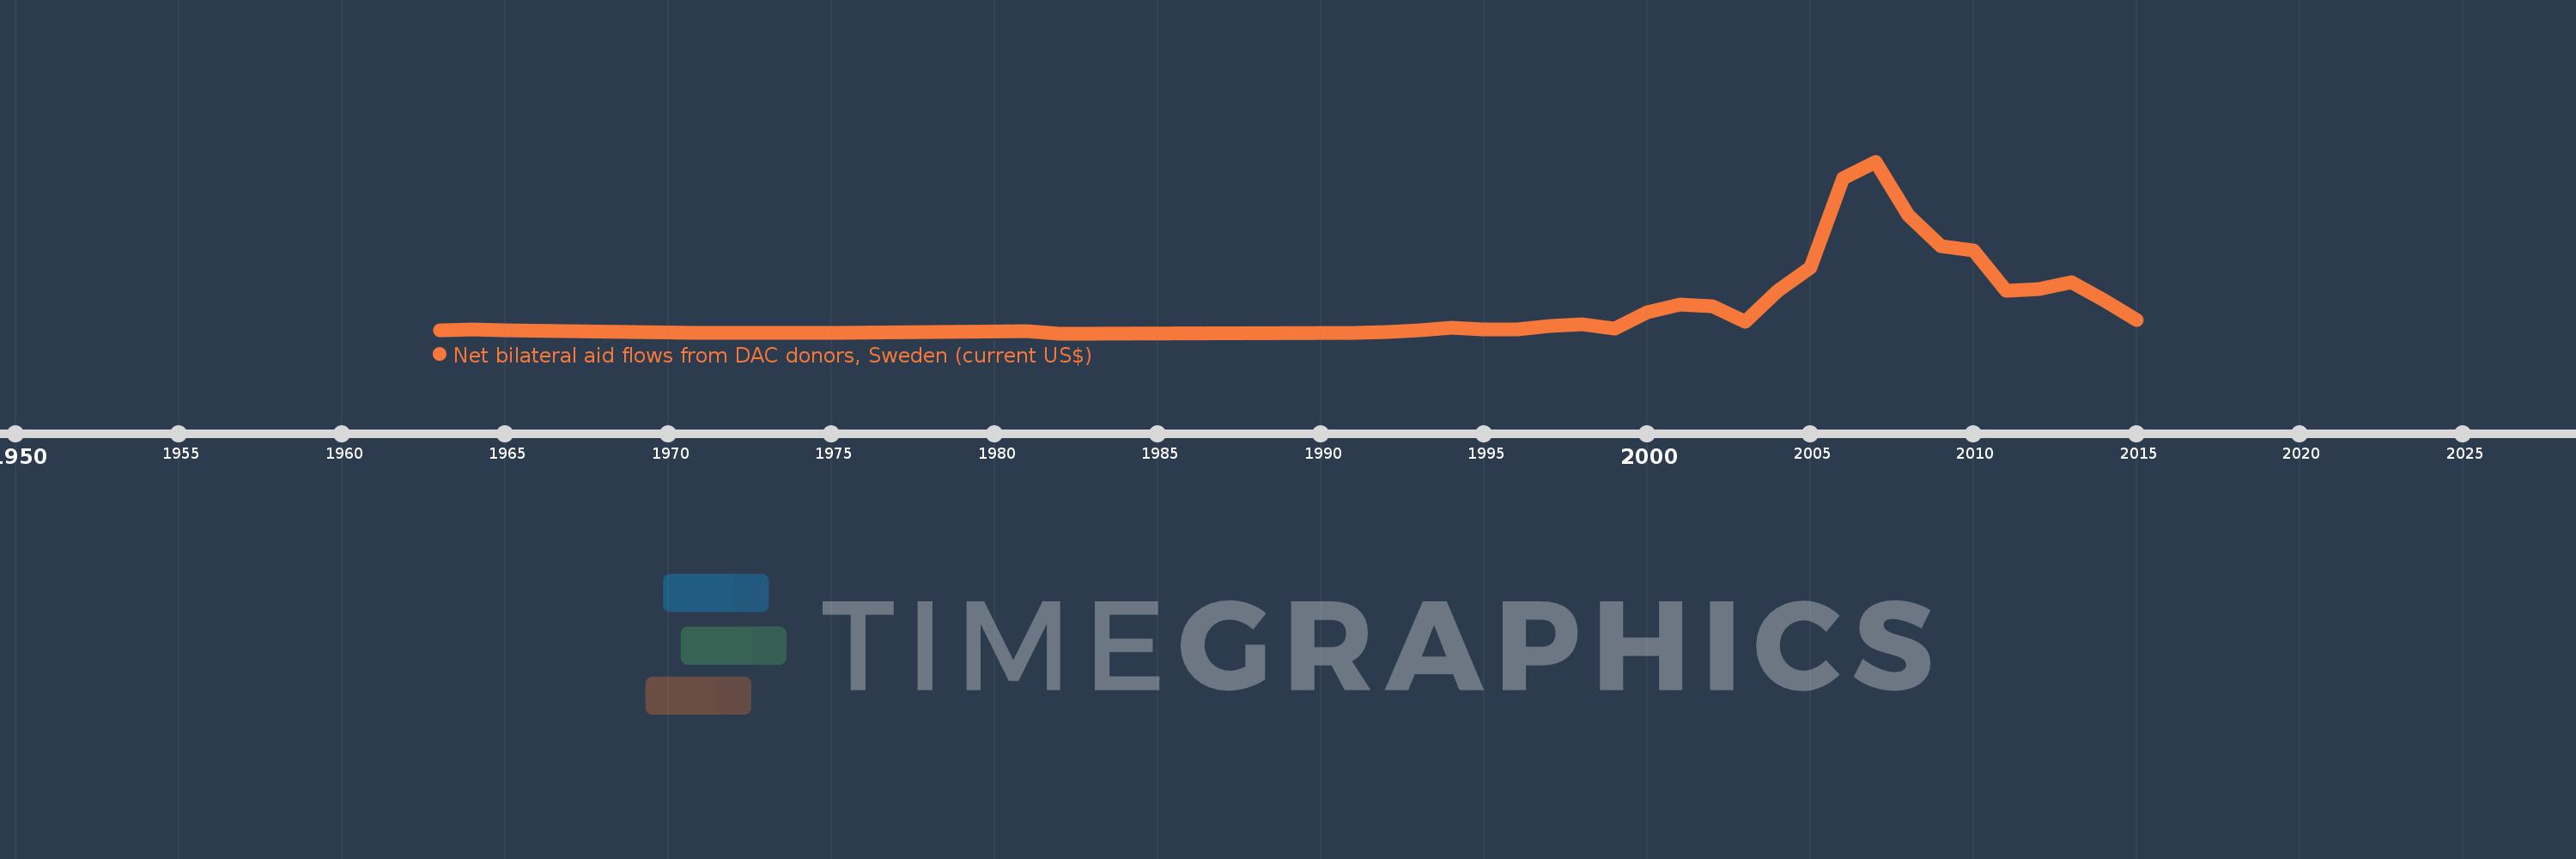
Net bilateral aid flows from DAC donors, Sweden (current US$)
2015,2014,2013,2012,2011,2010,2009,2008,2007,2006,2005,2004,2003,2002,2001,2000,1999,1998,1997,1996,1995,1994,1993,1992,1991,1982,1981,1975,1971,1965,1964,1963
Queste statistiche in altri paesi:
AfghanistanAlbaniaAlgeriaAngolaAntigua and BarbudaArab WorldArgentinaArmeniaAzerbaijanBangladeshBelarusBelizeBeninBhutanBoliviaBosnia and HerzegovinaBotswanaBrazilBrunei DarussalamBulgariaBurkina FasoBurundiCabo VerdeCambodiaCameroonCaribbean small statesCentral African RepublicCentral Europe and the BalticsChadChileChinaColombiaComorosCongo, Dem. Rep.Congo, Rep.Costa RicaCote d'IvoireCroatiaCubaCyprusCzech RepublicDjiboutiDominicaDominican RepublicEast Asia & PacificEast Asia & Pacific (excluding high income)East Asia & Pacific (IDA & IBRD countries)EcuadorEgypt, Arab Rep.El SalvadorEquatorial GuineaEritreaEstoniaEthiopiaEuro areaEurope & Central AsiaEurope & Central Asia (excluding high income)Europe & Central Asia (IDA & IBRD countries)European UnionFijiFragile and conflict affected situationsGabonGambia, TheGeorgiaGhanaGrenadaGuatemalaGuineaGuinea-BissauGuyanaHaitiHeavily indebted poor countries (HIPC)High incomeHondurasHong Kong SAR, ChinaHungaryIBRD onlyIDA & IBRD totalIDA blendIDA onlyIDA totalIndiaIndonesiaIran, Islamic Rep.IraqIsraelJamaicaJordanKazakhstanKenyaKorea, Dem. People’s Rep.Korea, Rep.KosovoKuwaitKyrgyz RepublicLao PDRLatin America & Caribbean Latin America & Caribbean (excluding high income)Latin America & the Caribbean (IDA & IBRD countries)LatviaLeast developed countries: UN classificationLebanonLesothoLiberiaLibyaLithuaniaLow & middle incomeLow incomeLower middle incomeMacao SAR, ChinaMacedonia, FYRMadagascarMalawiMalaysiaMaldivesMaliMarshall IslandsMauritaniaMauritiusMexicoMicronesia, Fed. Sts.Middle East & North AfricaMiddle East & North Africa (excluding high income)Middle East & North Africa (IDA & IBRD countries)Middle incomeMoldovaMongoliaMontenegroMoroccoMozambiqueMyanmarNamibiaNepalNicaraguaNigerNigeriaOECD membersOther small statesPacific island small statesPakistanPanamaPapua New GuineaParaguayPeruPhilippinesPolandRomaniaRussian FederationRwandaSamoaSao Tome and PrincipeSaudi ArabiaSenegalSerbiaSeychellesSierra LeoneSingaporeSlovak RepublicSloveniaSmall statesSolomon IslandsSomaliaSouth AfricaSouth AsiaSouth Asia (IDA & IBRD)South SudanSri LankaSt. Kitts and NevisSt. LuciaSt. Vincent and the GrenadinesSub-Saharan Africa Sub-Saharan Africa (excluding high income)Sub-Saharan Africa (IDA & IBRD countries)SudanSurinameSwazilandSyrian Arab RepublicTajikistanTanzaniaThailandTimor-LesteTogoTrinidad and TobagoTunisiaTurkeyTurkmenistanUgandaUkraineUpper middle incomeUruguayUzbekistanVanuatuVenezuela, RBVietnamWest Bank and GazaWorldYemen, Rep.ZambiaZimbabwe Linea del tempo:
Questa scala temporale mostra un grafico dal 1963 anno al 2015 anno. Indonesia. I dati fino ad 1962 anno non disponibili. Il numero di osservazioni attuali secondo i date: 32.
La fonte (nome):
Indicatori dello sviluppo mondiale
La fonte (organizzazione):
Development Assistance Committee of the Organisation for Economic Co-operation and Development, Geographical Distribution of Financial Flows to Developing Countries, Development Co-operation Report, and International Development Statistics database. Data are available online at: www.oecd.org/dac/stats/idsonline.
Categorie:
Aid Effectiveness
sono stati aggiornati
23 apr 2017 anni
Indicatori delle variazioni dei valori per anni
Minima:
10.0 Mille.
1 gen 1982 anni
Massimo:
23.9 Mln
1 gen 2007 anni
Alla data di osservazione
Valore
Variazione assoluta
La variazione rispetto al valore precedente
1 gen 1963 anni
450.0 Mille.
+450.0 Mille.
0.0%
1 gen 1964 anni
490.0 Mille.
+40.0 Mille.
8.89%
1 gen 1965 anni
440.0 Mille.
-50.0 Mille.
-10.2%
1 gen 1971 anni
20.0 Mille.
-420.0 Mille.
-95.45%
1 gen 1975 anni
20.0 Mille.
0.0
0.0%
1 gen 1981 anni
320.0 Mille.
+300.0 Mille.
1.5 Mille.%
1 gen 1982 anni
10.0 Mille.
-310.0 Mille.
-96.88%
1 gen 1991 anni
50.0 Mille.
+40.0 Mille.
400.0%
1 gen 1992 anni
200.0 Mille.
+150.0 Mille.
300.0%
1 gen 1993 anni
390.0 Mille.
+190.0 Mille.
95.0%
1 gen 1994 anni
820.0 Mille.
+430.0 Mille.
110.26%
1 gen 1995 anni
590.0 Mille.
-230.0 Mille.
-28.05%
1 gen 1996 anni
520.0 Mille.
-70.0 Mille.
-11.86%
1 gen 1997 anni
1.05 Mln
+530.0 Mille.
101.92%
1 gen 1998 anni
1.31 Mln
+260.0 Mille.
24.76%
1 gen 1999 anni
610.0 Mille.
-700.0 Mille.
-53.44%
1 gen 2000 anni
2.97 Mln
+2.36 Mln
386.89%
1 gen 2001 anni
4.07 Mln
+1.1 Mln
37.04%
1 gen 2002 anni
3.74 Mln
-330.0 Mille.
-8.11%
1 gen 2003 anni
1.58 Mln
-2.16 Mln
-57.75%
1 gen 2004 anni
5.94 Mln
+4.36 Mln
275.95%
1 gen 2005 anni
9.12 Mln
+3.18 Mln
53.54%
1 gen 2006 anni
21.6 Mln
+12.48 Mln
136.84%
1 gen 2007 anni
23.9 Mln
+2.3 Mln
10.65%
1 gen 2008 anni
16.44 Mln
-7.46 Mln
-31.21%
1 gen 2009 anni
12.15 Mln
-4.29 Mln
-26.09%
1 gen 2010 anni
11.58 Mln
-570.0 Mille.
-4.69%
1 gen 2011 anni
5.94 Mln
-5.64 Mln
-48.7%
1 gen 2012 anni
6.2 Mln
+260.0 Mille.
4.38%
1 gen 2013 anni
7.12 Mln
+920.0 Mille.
14.84%
1 gen 2014 anni
4.64 Mln
-2.48 Mln
-34.83%
1 gen 2015 anni
1.87 Mln
-2.77 Mln
-59.7%
Classificazione dei paesi secondo i statistiche attuali per anni


Commenti: