29
/it/
it
AIzaSyAYiBZKx7MnpbEhh9jyipgxe19OcubqV5w
April 1, 2024
155450
India
IND
true
2
1
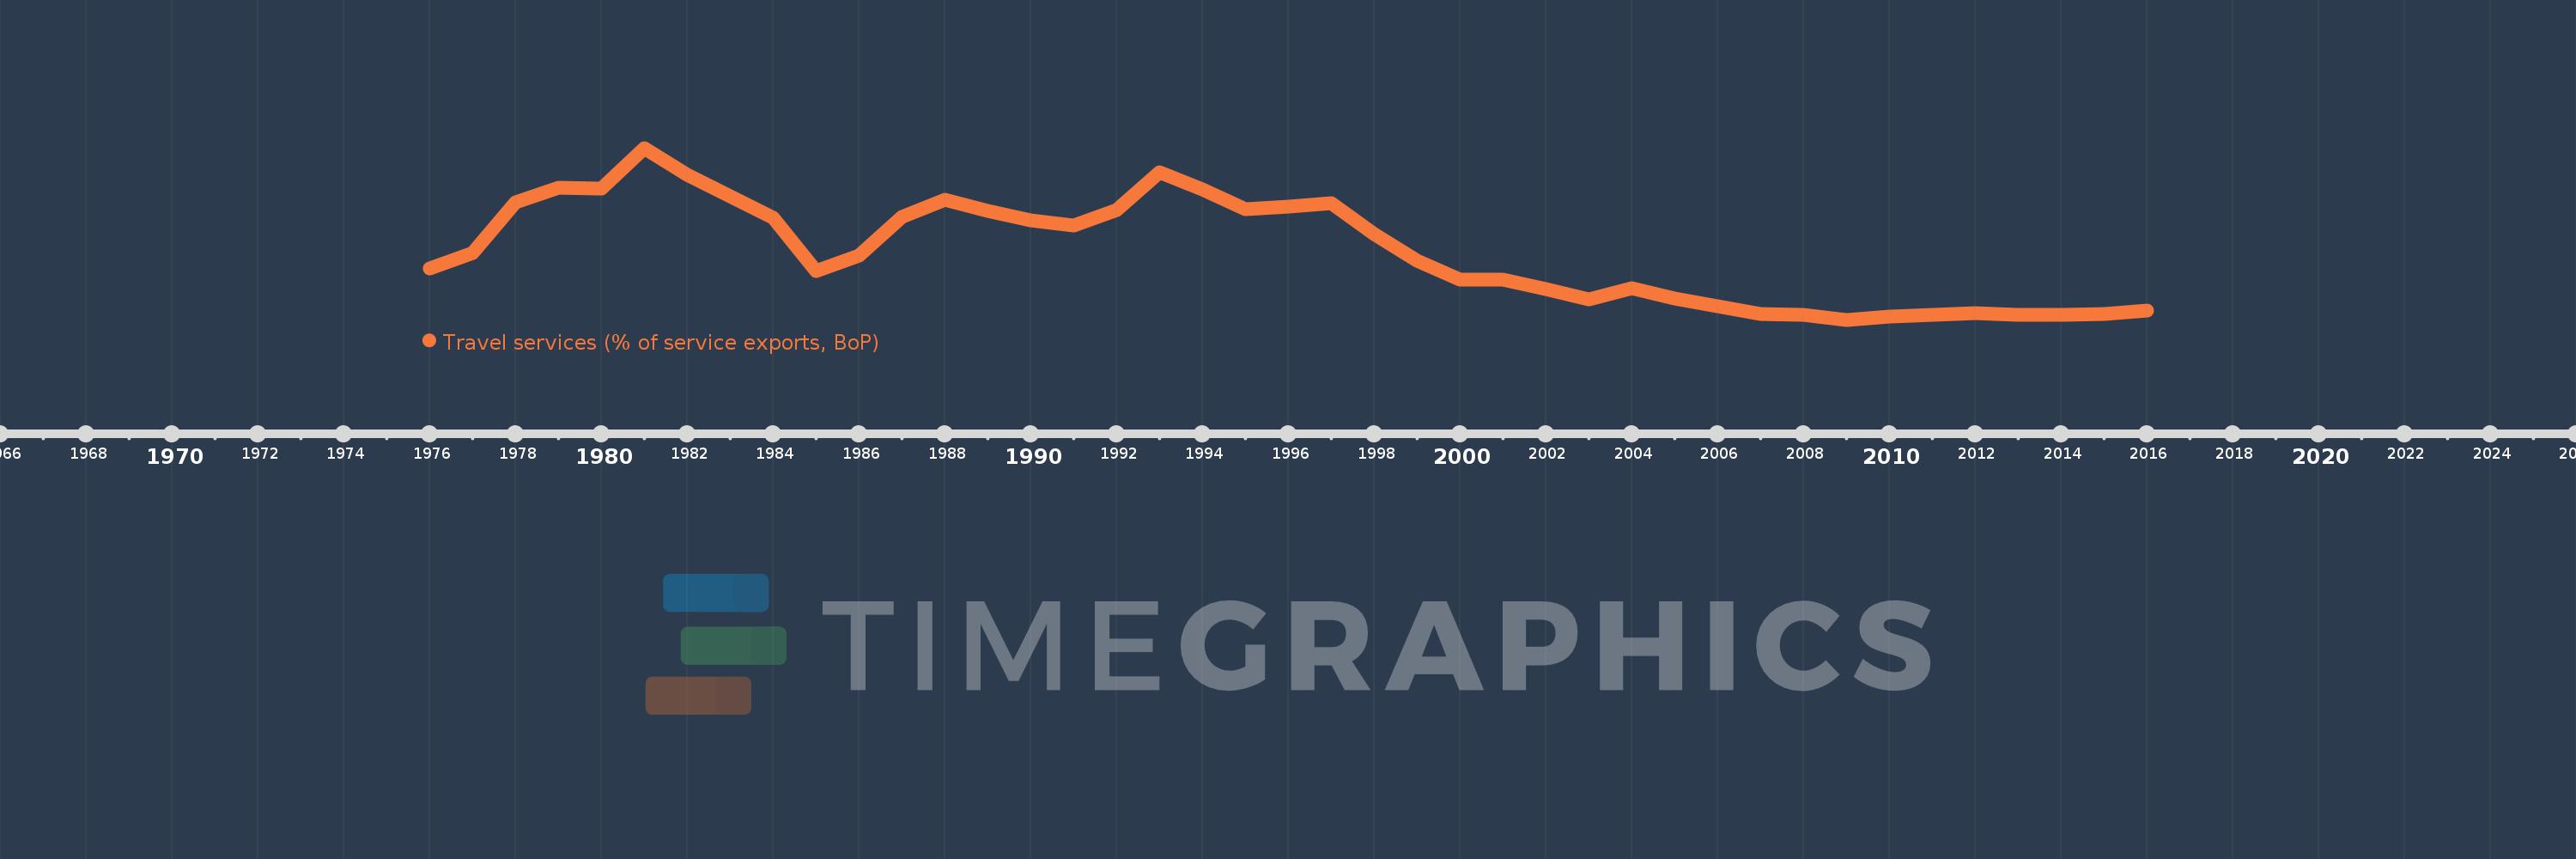
Travel services (% of service exports, BoP)
2016,2015,2014,2013,2012,2011,2010,2009,2008,2007,2006,2005,2004,2003,2002,2001,2000,1999,1998,1997,1996,1995,1994,1993,1992,1991,1990,1989,1988,1987,1986,1985,1984,1983,1982,1981,1980,1979,1978,1977,1976
Queste statistiche in altri paesi:
AfghanistanAlbaniaAlgeriaAngolaAntigua and BarbudaArab WorldArgentinaArmeniaArubaAustraliaAustriaAzerbaijanBahamas, TheBahrainBangladeshBarbadosBelarusBelgiumBelizeBeninBermudaBhutanBoliviaBosnia and HerzegovinaBotswanaBrazilBrunei DarussalamBulgariaBurkina FasoBurundiCabo VerdeCambodiaCameroonCanadaCaribbean small statesCentral African RepublicCentral Europe and the BalticsChadChileChinaColombiaComorosCongo, Dem. Rep.Congo, Rep.Costa RicaCote d'IvoireCroatiaCuracaoCyprusCzech RepublicDenmarkDjiboutiDominicaDominican RepublicEarly-demographic dividendEast Asia & PacificEast Asia & Pacific (excluding high income)East Asia & Pacific (IDA & IBRD countries)EcuadorEgypt, Arab Rep.El SalvadorEritreaEstoniaEthiopiaEuro areaEurope & Central AsiaEurope & Central Asia (excluding high income)Europe & Central Asia (IDA & IBRD countries)European UnionFaroe IslandsFijiFinlandFragile and conflict affected situationsFranceFrench PolynesiaGabonGambia, TheGeorgiaGermanyGhanaGreeceGrenadaGuatemalaGuineaGuinea-BissauGuyanaHaitiHeavily indebted poor countries (HIPC)High incomeHondurasHong Kong SAR, ChinaHungaryIBRD onlyIcelandIDA & IBRD totalIDA onlyIDA totalIndiaIndonesiaIran, Islamic Rep.IraqIrelandIsraelItalyJamaicaJapanJordanKazakhstanKenyaKiribatiKorea, Rep.KosovoKuwaitKyrgyz RepublicLao PDRLate-demographic dividendLatin America & Caribbean Latin America & Caribbean (excluding high income)Latin America & the Caribbean (IDA & IBRD countries)LatviaLeast developed countries: UN classificationLebanonLesothoLiberiaLibyaLithuaniaLow & middle incomeLow incomeLower middle incomeLuxembourgMacao SAR, ChinaMacedonia, FYRMadagascarMalawiMalaysiaMaldivesMaliMaltaMarshall IslandsMauritaniaMauritiusMexicoMicronesia, Fed. Sts.Middle East & North Africa (excluding high income)Middle East & North Africa (IDA & IBRD countries)Middle incomeMoldovaMongoliaMontenegroMoroccoMozambiqueMyanmarNamibiaNepalNetherlandsNew CaledoniaNew ZealandNicaraguaNigerNigeriaNorth AmericaNorwayOECD membersOmanOther small statesPacific island small statesPakistanPalauPanamaPapua New GuineaParaguayPeruPhilippinesPolandPortugalPost-demographic dividendPre-demographic dividendQatarRomaniaRussian FederationRwandaSamoaSao Tome and PrincipeSaudi ArabiaSenegalSerbiaSeychellesSierra LeoneSingaporeSint Maarten (Dutch part)Slovak RepublicSloveniaSmall statesSolomon IslandsSouth AfricaSouth AsiaSouth Asia (IDA & IBRD)South SudanSpainSri LankaSt. Kitts and NevisSt. LuciaSt. Vincent and the GrenadinesSub-Saharan Africa Sub-Saharan Africa (excluding high income)Sub-Saharan Africa (IDA & IBRD countries)SudanSurinameSwazilandSwedenSwitzerlandSyrian Arab RepublicTajikistanTanzaniaThailandTimor-LesteTogoTongaTrinidad and TobagoTunisiaTurkeyTuvaluUgandaUkraineUnited KingdomUnited StatesUpper middle incomeUruguayVanuatuVenezuela, RBWest Bank and GazaWorldYemen, Rep.ZambiaZimbabwe Linea del tempo:
Questa scala temporale mostra un grafico dal 1976 anno al 2016 anno. India. I dati fino ad 1975 anno non disponibili. Il numero di osservazioni attuali secondo i date: 41.
La fonte (nome):
Indicatori dello sviluppo mondiale
La fonte (organizzazione):
International Monetary Fund, Balance of Payments Statistics Yearbook and data files.
Categorie:
Economy & Growth, Trade
sono stati aggiornati
23 apr 2017 anni
Indicatori delle variazioni dei valori per anni
Minima:
11.157
1 gen 2009 anni
Massimo:
52.228
1 gen 1981 anni
Alla data di osservazione
Valore
Variazione assoluta
La variazione rispetto al valore precedente
1 gen 1976 anni
23.438
+23.438
0.0%
1 gen 1977 anni
27.068
+3.631
15.49%
1 gen 1978 anni
39.21
+12.141
44.85%
1 gen 1979 anni
42.757
+3.547
9.05%
1 gen 1980 anni
42.611
-0.147
-0.34%
1 gen 1981 anni
52.228
+9.618
22.57%
1 gen 1982 anni
45.707
-6.522
-12.49%
1 gen 1983 anni
40.57
-5.137
-11.24%
1 gen 1984 anni
35.621
-4.949
-12.2%
1 gen 1985 anni
22.753
-12.869
-36.13%
1 gen 1986 anni
26.517
+3.765
16.55%
1 gen 1987 anni
35.828
+9.31
35.11%
1 gen 1988 anni
39.924
+4.096
11.43%
1 gen 1989 anni
37.106
-2.818
-7.06%
1 gen 1990 anni
34.995
-2.111
-5.69%
1 gen 1991 anni
33.695
-1.299
-3.71%
1 gen 1992 anni
37.388
+3.693
10.96%
1 gen 1993 anni
46.519
+9.131
24.42%
1 gen 1994 anni
42.277
-4.243
-9.12%
1 gen 1995 anni
37.63
-4.647
-10.99%
1 gen 1996 anni
38.105
+0.475
1.26%
1 gen 1997 anni
39.114
+1.009
2.65%
1 gen 1998 anni
31.719
-7.395
-18.91%
1 gen 1999 anni
25.22
-6.499
-20.49%
1 gen 2000 anni
20.743
-4.477
-17.75%
1 gen 2001 anni
20.736
-0.007
-0.03%
1 gen 2002 anni
18.446
-2.29
-11.04%
1 gen 2003 anni
15.926
-2.52
-13.66%
1 gen 2004 anni
18.671
+2.744
17.23%
1 gen 2005 anni
16.194
-2.476
-13.26%
1 gen 2006 anni
14.36
-1.834
-11.33%
1 gen 2007 anni
12.434
-1.926
-13.41%
1 gen 2008 anni
12.396
-0.037
-0.3%
1 gen 2009 anni
11.157
-1.24
-10.0%
1 gen 2010 anni
11.988
+0.832
7.45%
1 gen 2011 anni
12.377
+0.389
3.24%
1 gen 2012 anni
12.783
+0.406
3.28%
1 gen 2013 anni
12.349
-0.433
-3.39%
1 gen 2014 anni
12.333
-0.016
-0.13%
1 gen 2015 anni
12.532
+0.199
1.61%
1 gen 2016 anni
13.446
+0.913
7.29%
Classificazione dei paesi secondo i statistiche attuali per anni


Commenti: