29
/it/
it
AIzaSyAYiBZKx7MnpbEhh9jyipgxe19OcubqV5w
April 1, 2024
154632
India
IND
true
2
1
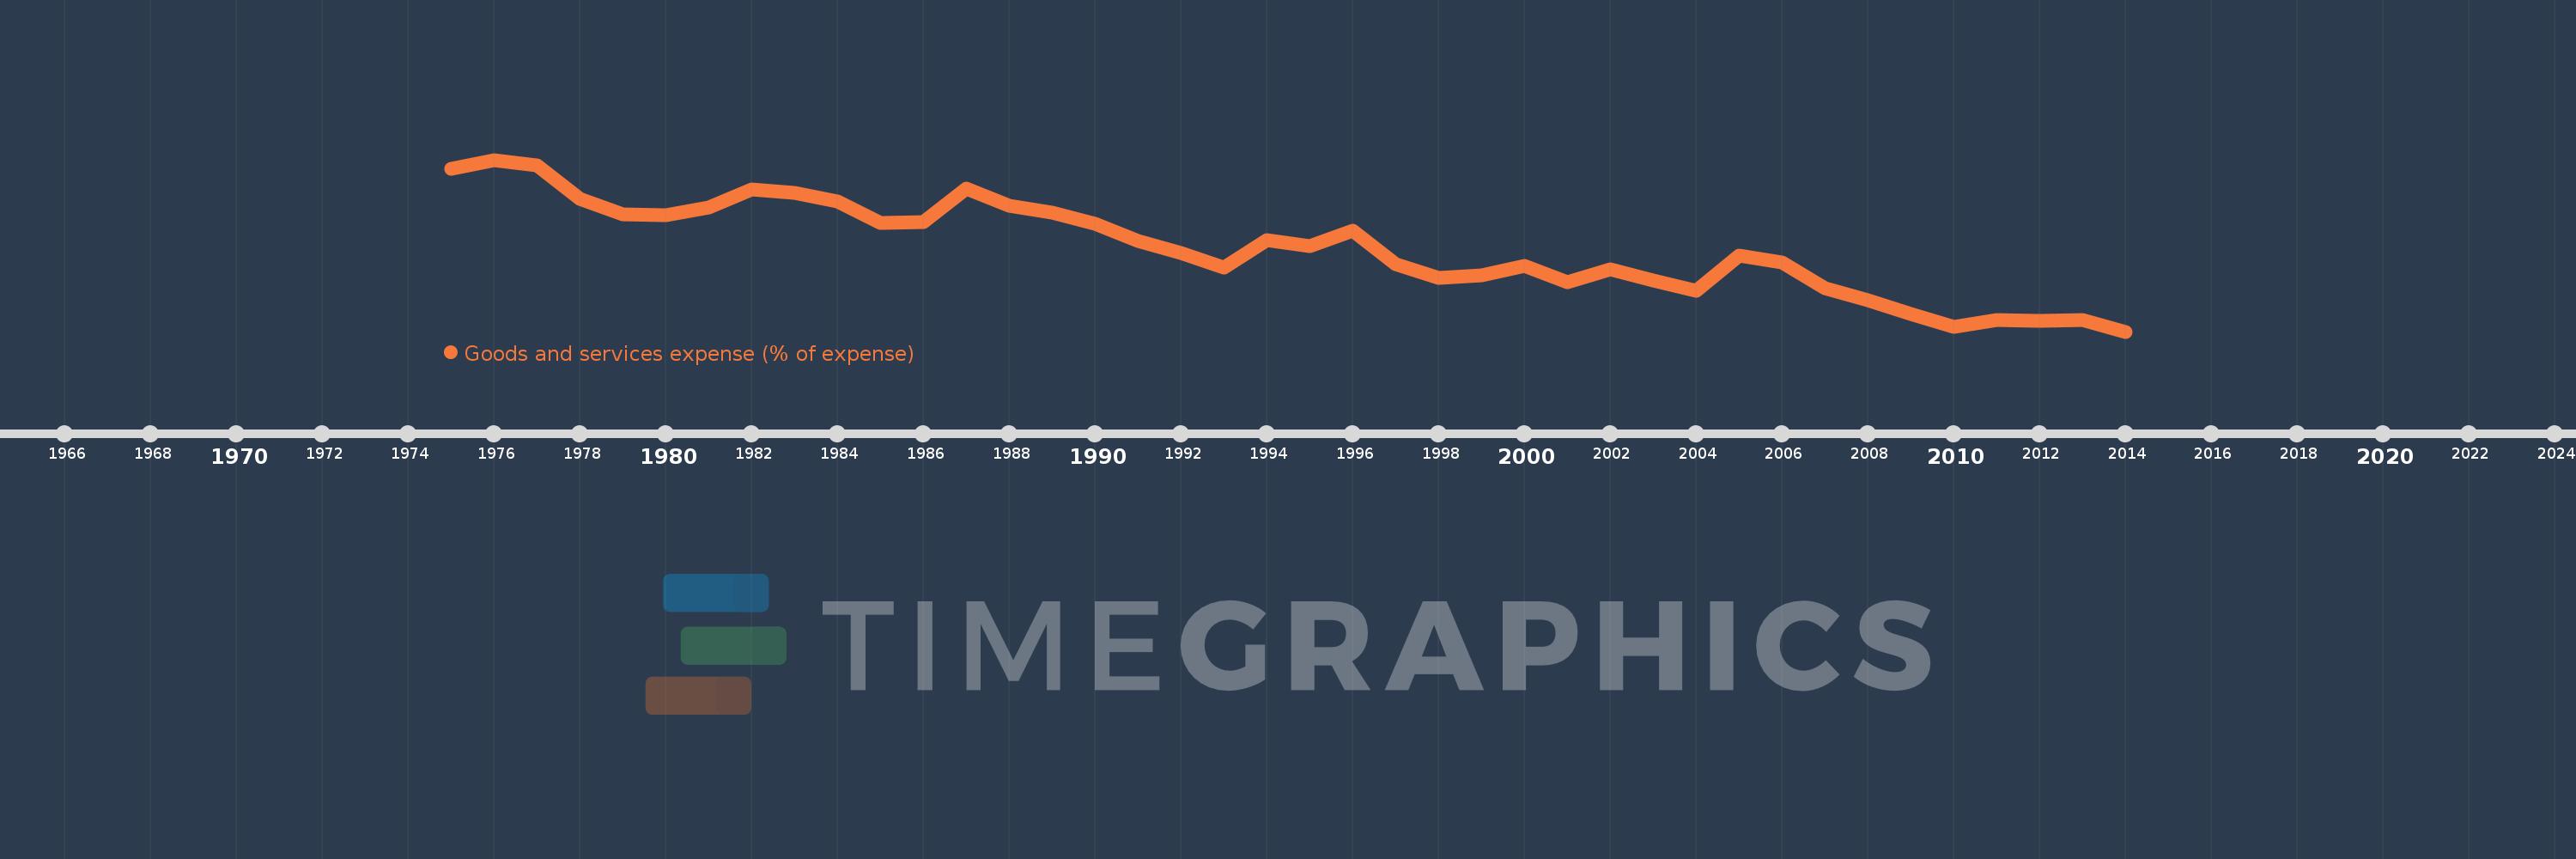
Goods and services expense (% of expense)
2014,2013,2012,2011,2010,2009,2008,2007,2006,2005,2004,2003,2002,2001,2000,1999,1998,1997,1996,1995,1994,1993,1992,1991,1990,1989,1988,1987,1986,1985,1984,1983,1982,1981,1980,1979,1978,1977,1976,1975
Queste statistiche in altri paesi:
AfghanistanAlbaniaAlgeriaAngolaAntigua and BarbudaArab WorldArmeniaAustraliaAustriaAzerbaijanBahamas, TheBahrainBangladeshBarbadosBelarusBelgiumBelizeBeninBhutanBoliviaBosnia and HerzegovinaBotswanaBrazilBulgariaBurkina FasoBurundiCabo VerdeCambodiaCanadaCaribbean small statesCentral African RepublicCentral Europe and the BalticsChileColombiaCongo, Dem. Rep.Congo, Rep.Costa RicaCote d'IvoireCroatiaCyprusCzech RepublicDenmarkDominicaDominican RepublicEarly-demographic dividendEast Asia & PacificEast Asia & Pacific (excluding high income)East Asia & Pacific (IDA & IBRD countries)Egypt, Arab Rep.El SalvadorEquatorial GuineaEstoniaEthiopiaEuro areaEurope & Central AsiaEurope & Central Asia (excluding high income)Europe & Central Asia (IDA & IBRD countries)European UnionFijiFinlandFranceGambia, TheGeorgiaGermanyGhanaGreeceGrenadaGuatemalaHeavily indebted poor countries (HIPC)High incomeHondurasHong Kong SAR, ChinaHungaryIBRD onlyIcelandIDA & IBRD totalIDA blendIDA onlyIDA totalIndiaIndonesiaIran, Islamic Rep.IraqIrelandIsraelItalyJamaicaJapanJordanKazakhstanKenyaKiribatiKorea, Rep.KuwaitKyrgyz RepublicLao PDRLate-demographic dividendLatin America & Caribbean Latin America & Caribbean (excluding high income)Latin America & the Caribbean (IDA & IBRD countries)LatviaLeast developed countries: UN classificationLebanonLesothoLiberiaLithuaniaLow & middle incomeLow incomeLower middle incomeLuxembourgMacao SAR, ChinaMacedonia, FYRMadagascarMalawiMalaysiaMaldivesMaliMaltaMauritiusMexicoMicronesia, Fed. Sts.Middle East & North AfricaMiddle East & North Africa (excluding high income)Middle East & North Africa (IDA & IBRD countries)Middle incomeMoldovaMongoliaMoroccoMozambiqueNamibiaNepalNetherlandsNew ZealandNicaraguaNigeriaNorth AmericaNorwayOECD membersOmanOther small statesPakistanPanamaPapua New GuineaParaguayPeruPhilippinesPolandPortugalPost-demographic dividendPre-demographic dividendQatarRomaniaRussian FederationRwandaSamoaSan MarinoSao Tome and PrincipeSenegalSerbiaSeychellesSierra LeoneSingaporeSlovak RepublicSloveniaSmall statesSolomon IslandsSouth AfricaSouth AsiaSouth Asia (IDA & IBRD)SpainSri LankaSt. Kitts and NevisSt. LuciaSub-Saharan Africa Sub-Saharan Africa (excluding high income)Sub-Saharan Africa (IDA & IBRD countries)SurinameSwazilandSwedenSwitzerlandSyrian Arab RepublicTajikistanTanzaniaThailandTimor-LesteTogoTrinidad and TobagoTunisiaTurkeyUgandaUkraineUnited Arab EmiratesUnited KingdomUnited StatesUpper middle incomeUruguayVanuatuVenezuela, RBWest Bank and GazaWorldYemen, Rep.ZambiaZimbabwe Linea del tempo:
Questa scala temporale mostra un grafico dal 1975 anno al 2014 anno. India. I dati fino ad 1974 anno non disponibili. Il numero di osservazioni attuali secondo i date: 40.
La fonte (nome):
Indicatori dello sviluppo mondiale
La fonte (organizzazione):
International Monetary Fund, Government Finance Statistics Yearbook and data files.
Categorie:
Public Sector
sono stati aggiornati
23 apr 2017 anni
Indicatori delle variazioni dei valori per anni
Minima:
8.742
1 gen 2014 anni
Massimo:
18.487
1 gen 1976 anni
Alla data di osservazione
Valore
Variazione assoluta
La variazione rispetto al valore precedente
1 gen 1975 anni
17.989
+17.989
0.0%
1 gen 1976 anni
18.487
+0.498
2.77%
1 gen 1977 anni
18.147
-0.339
-1.84%
1 gen 1978 anni
16.252
-1.896
-10.45%
1 gen 1979 anni
15.388
-0.864
-5.31%
1 gen 1980 anni
15.346
-0.043
-0.28%
1 gen 1981 anni
15.782
+0.436
2.84%
1 gen 1982 anni
16.82
+1.039
6.58%
1 gen 1983 anni
16.588
-0.232
-1.38%
1 gen 1984 anni
16.105
-0.483
-2.91%
1 gen 1985 anni
14.922
-1.183
-7.34%
1 gen 1986 anni
14.949
+0.026
0.18%
1 gen 1987 anni
16.849
+1.9
12.71%
1 gen 1988 anni
15.87
-0.979
-5.81%
1 gen 1989 anni
15.51
-0.361
-2.27%
1 gen 1990 anni
14.853
-0.657
-4.23%
1 gen 1991 anni
13.888
-0.965
-6.5%
1 gen 1992 anni
13.188
-0.7
-5.04%
1 gen 1993 anni
12.376
-0.812
-6.15%
1 gen 1994 anni
13.912
+1.536
12.41%
1 gen 1995 anni
13.582
-0.33
-2.37%
1 gen 1996 anni
14.466
+0.884
6.51%
1 gen 1997 anni
12.571
-1.896
-13.1%
1 gen 1998 anni
11.767
-0.803
-6.39%
1 gen 1999 anni
11.956
+0.189
1.6%
1 gen 2000 anni
12.459
+0.503
4.21%
1 gen 2001 anni
11.558
-0.902
-7.24%
1 gen 2002 anni
12.251
+0.694
6.0%
1 gen 2003 anni
11.623
-0.628
-5.13%
1 gen 2004 anni
11.037
-0.586
-5.04%
1 gen 2005 anni
13.042
+2.005
18.16%
1 gen 2006 anni
12.671
-0.371
-2.85%
1 gen 2007 anni
11.182
-1.488
-11.75%
1 gen 2008 anni
10.511
-0.672
-6.01%
1 gen 2009 anni
9.764
-0.747
-7.1%
1 gen 2010 anni
8.998
-0.766
-7.84%
1 gen 2011 anni
9.392
+0.394
4.38%
1 gen 2012 anni
9.349
-0.043
-0.46%
1 gen 2013 anni
9.42
+0.071
0.76%
1 gen 2014 anni
8.742
-0.679
-7.2%
Classificazione dei paesi secondo i statistiche attuali per anni


Commenti: