29
/it/
it
AIzaSyAYiBZKx7MnpbEhh9jyipgxe19OcubqV5w
April 1, 2024
154243
India
IND
true
2
1
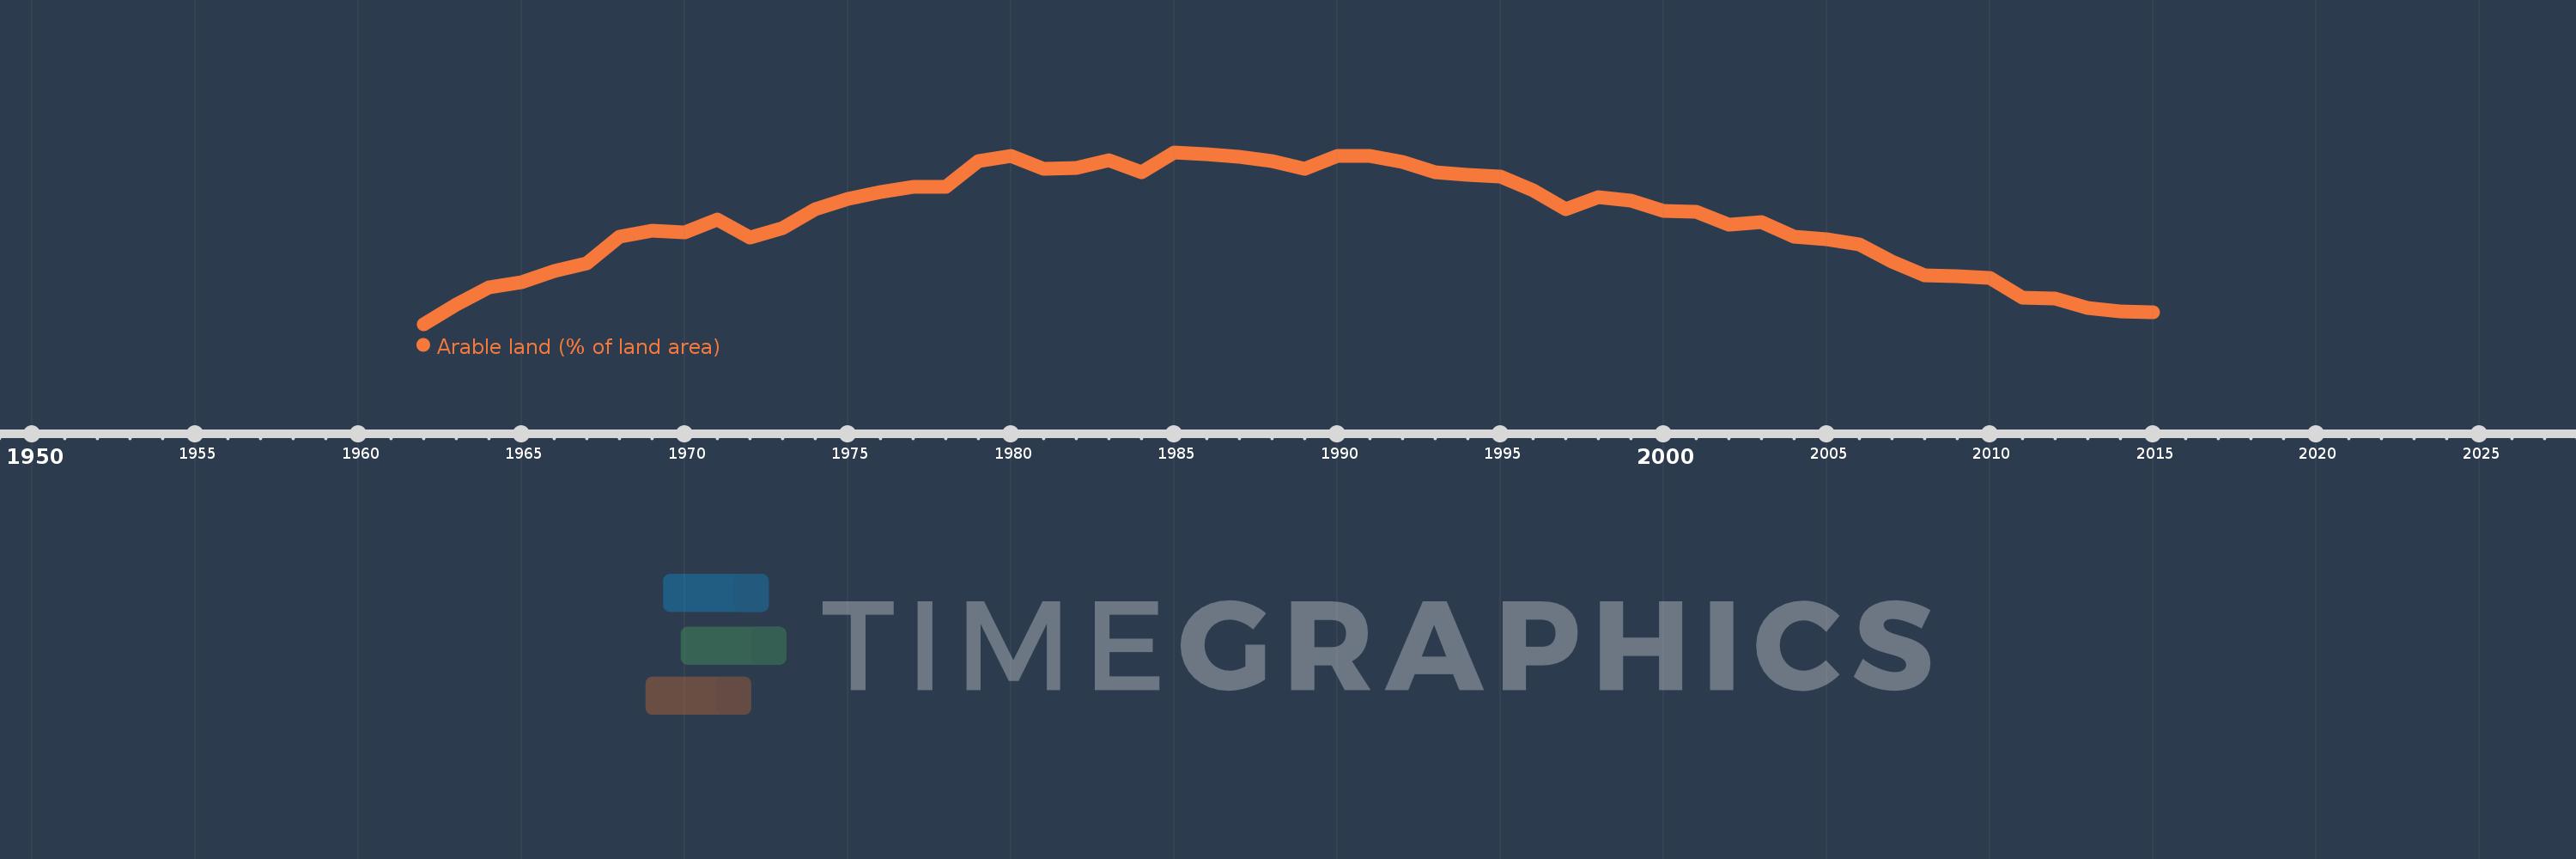
Arable land (% of land area)
2015,2014,2013,2012,2011,2010,2009,2008,2007,2006,2005,2004,2003,2002,2001,2000,1999,1998,1997,1996,1995,1994,1993,1992,1991,1990,1989,1988,1987,1986,1985,1984,1983,1982,1981,1980,1979,1978,1977,1976,1975,1974,1973,1972,1971,1970,1969,1968,1967,1966,1965,1964,1963,1962
Queste statistiche in altri paesi:
AfghanistanAlbaniaAlgeriaAmerican SamoaAndorraAngolaAntigua and BarbudaArab WorldArgentinaArmeniaArubaAustraliaAustriaAzerbaijanBahamas, TheBahrainBangladeshBarbadosBelarusBelgiumBelizeBeninBermudaBhutanBoliviaBosnia and HerzegovinaBotswanaBrazilBritish Virgin IslandsBrunei DarussalamBulgariaBurkina FasoBurundiCabo VerdeCambodiaCameroonCanadaCaribbean small statesCayman IslandsCentral African RepublicCentral Europe and the BalticsChadChannel IslandsChileChinaColombiaComorosCongo, Dem. Rep.Congo, Rep.Costa RicaCote d'IvoireCroatiaCubaCyprusCzech RepublicDenmarkDjiboutiDominicaDominican RepublicEarly-demographic dividendEast Asia & PacificEast Asia & Pacific (excluding high income)East Asia & Pacific (IDA & IBRD countries)EcuadorEgypt, Arab Rep.El SalvadorEquatorial GuineaEritreaEstoniaEthiopiaEuro areaEurope & Central AsiaEurope & Central Asia (excluding high income)Europe & Central Asia (IDA & IBRD countries)European UnionFaroe IslandsFijiFinlandFragile and conflict affected situationsFranceFrench PolynesiaGabonGambia, TheGeorgiaGermanyGhanaGreeceGreenlandGrenadaGuamGuatemalaGuineaGuinea-BissauGuyanaHaitiHeavily indebted poor countries (HIPC)High incomeHondurasHong Kong SAR, ChinaHungaryIBRD onlyIcelandIDA & IBRD totalIDA blendIDA onlyIDA totalIndiaIndonesiaIran, Islamic Rep.IraqIrelandIsle of ManIsraelItalyJamaicaJapanJordanKazakhstanKenyaKiribatiKorea, Dem. People’s Rep.Korea, Rep.KosovoKuwaitKyrgyz RepublicLao PDRLate-demographic dividendLatin America & Caribbean Latin America & Caribbean (excluding high income)Latin America & the Caribbean (IDA & IBRD countries)LatviaLeast developed countries: UN classificationLebanonLesothoLiberiaLibyaLiechtensteinLithuaniaLow & middle incomeLow incomeLower middle incomeLuxembourgMacedonia, FYRMadagascarMalawiMalaysiaMaldivesMaliMaltaMarshall IslandsMauritaniaMauritiusMexicoMicronesia, Fed. Sts.Middle East & North AfricaMiddle East & North Africa (excluding high income)Middle East & North Africa (IDA & IBRD countries)Middle incomeMoldovaMongoliaMontenegroMoroccoMozambiqueMyanmarNamibiaNepalNetherlandsNew CaledoniaNew ZealandNicaraguaNigerNigeriaNorth AmericaNorthern Mariana IslandsNorwayOECD membersOmanOther small statesPacific island small statesPakistanPalauPanamaPapua New GuineaParaguayPeruPhilippinesPolandPortugalPost-demographic dividendPre-demographic dividendPuerto RicoQatarRomaniaRussian FederationRwandaSamoaSan MarinoSao Tome and PrincipeSaudi ArabiaSenegalSerbiaSeychellesSierra LeoneSingaporeSlovak RepublicSloveniaSmall statesSolomon IslandsSomaliaSouth AfricaSouth AsiaSouth Asia (IDA & IBRD)SpainSri LankaSt. Kitts and NevisSt. LuciaSt. Vincent and the GrenadinesSub-Saharan Africa Sub-Saharan Africa (excluding high income)Sub-Saharan Africa (IDA & IBRD countries)SudanSurinameSwazilandSwedenSwitzerlandSyrian Arab RepublicTajikistanTanzaniaThailandTimor-LesteTogoTongaTrinidad and TobagoTunisiaTurkeyTurkmenistanTurks and Caicos IslandsUgandaUkraineUnited Arab EmiratesUnited KingdomUnited StatesUpper middle incomeUruguayUzbekistanVanuatuVenezuela, RBVietnamVirgin Islands (U.S.)West Bank and GazaWorldYemen, Rep.ZambiaZimbabwe Linea del tempo:
Questa scala temporale mostra un grafico dal 1962 anno al 2015 anno. India. I dati fino ad 1961 anno non disponibili. Il numero di osservazioni attuali secondo i date: 54.
La fonte (nome):
Indicatori dello sviluppo mondiale
La fonte (organizzazione):
Food and Agriculture Organization, electronic files and web site.
Categorie:
Agriculture & Rural Development, Climate Change, Environment
sono stati aggiornati
23 apr 2017 anni
Indicatori delle variazioni dei valori per anni
Minima:
52.404
1 gen 1962 anni
Massimo:
55.031
1 gen 1985 anni
Alla data di osservazione
Valore
Variazione assoluta
La variazione rispetto al valore precedente
1 gen 1962 anni
52.404
+52.404
0.0%
1 gen 1963 anni
52.704
+0.301
0.57%
1 gen 1964 anni
52.963
+0.259
0.49%
1 gen 1965 anni
53.051
+0.088
0.17%
1 gen 1966 anni
53.214
+0.163
0.31%
1 gen 1967 anni
53.34
+0.126
0.24%
1 gen 1968 anni
53.74
+0.4
0.75%
1 gen 1969 anni
53.837
+0.097
0.18%
1 gen 1970 anni
53.806
-0.031
-0.06%
1 gen 1971 anni
54.003
+0.196
0.37%
1 gen 1972 anni
53.732
-0.27
-0.5%
1 gen 1973 anni
53.877
+0.145
0.27%
1 gen 1974 anni
54.165
+0.289
0.54%
1 gen 1975 anni
54.319
+0.154
0.28%
1 gen 1976 anni
54.432
+0.113
0.21%
1 gen 1977 anni
54.506
+0.074
0.14%
1 gen 1978 anni
54.507
+0.001
0.0%
1 gen 1979 anni
54.904
+0.397
0.73%
1 gen 1980 anni
54.973
+0.069
0.13%
1 gen 1981 anni
54.774
-0.198
-0.36%
1 gen 1982 anni
54.794
+0.02
0.04%
1 gen 1983 anni
54.906
+0.112
0.21%
1 gen 1984 anni
54.733
-0.173
-0.31%
1 gen 1985 anni
55.031
+0.298
0.54%
1 gen 1986 anni
55.005
-0.026
-0.05%
1 gen 1987 anni
54.961
-0.044
-0.08%
1 gen 1988 anni
54.892
-0.069
-0.12%
1 gen 1989 anni
54.779
-0.113
-0.21%
1 gen 1990 anni
54.983
+0.204
0.37%
1 gen 1991 anni
54.978
-0.006
-0.01%
1 gen 1992 anni
54.884
-0.093
-0.17%
1 gen 1993 anni
54.724
-0.16
-0.29%
1 gen 1994 anni
54.684
-0.04
-0.07%
1 gen 1995 anni
54.664
-0.021
-0.04%
1 gen 1996 anni
54.457
-0.207
-0.38%
1 gen 1997 anni
54.159
-0.298
-0.55%
1 gen 1998 anni
54.353
+0.194
0.36%
1 gen 1999 anni
54.288
-0.065
-0.12%
1 gen 2000 anni
54.142
-0.146
-0.27%
1 gen 2001 anni
54.127
-0.015
-0.03%
1 gen 2002 anni
53.924
-0.203
-0.38%
1 gen 2003 anni
53.96
+0.036
0.07%
1 gen 2004 anni
53.747
-0.213
-0.39%
1 gen 2005 anni
53.707
-0.04
-0.07%
1 gen 2006 anni
53.627
-0.08
-0.15%
1 gen 2007 anni
53.364
-0.263
-0.49%
1 gen 2008 anni
53.149
-0.215
-0.4%
1 gen 2009 anni
53.14
-0.009
-0.02%
1 gen 2010 anni
53.116
-0.024
-0.04%
1 gen 2011 anni
52.808
-0.308
-0.58%
1 gen 2012 anni
52.798
-0.01
-0.02%
1 gen 2013 anni
52.653
-0.146
-0.28%
1 gen 2014 anni
52.594
-0.059
-0.11%
1 gen 2015 anni
52.59
-0.004
-0.01%
Classificazione dei paesi secondo i statistiche attuali per anni


Commenti: