29
/it/
it
AIzaSyAYiBZKx7MnpbEhh9jyipgxe19OcubqV5w
April 1, 2024
152771
Hungary
HUN
true
2
1
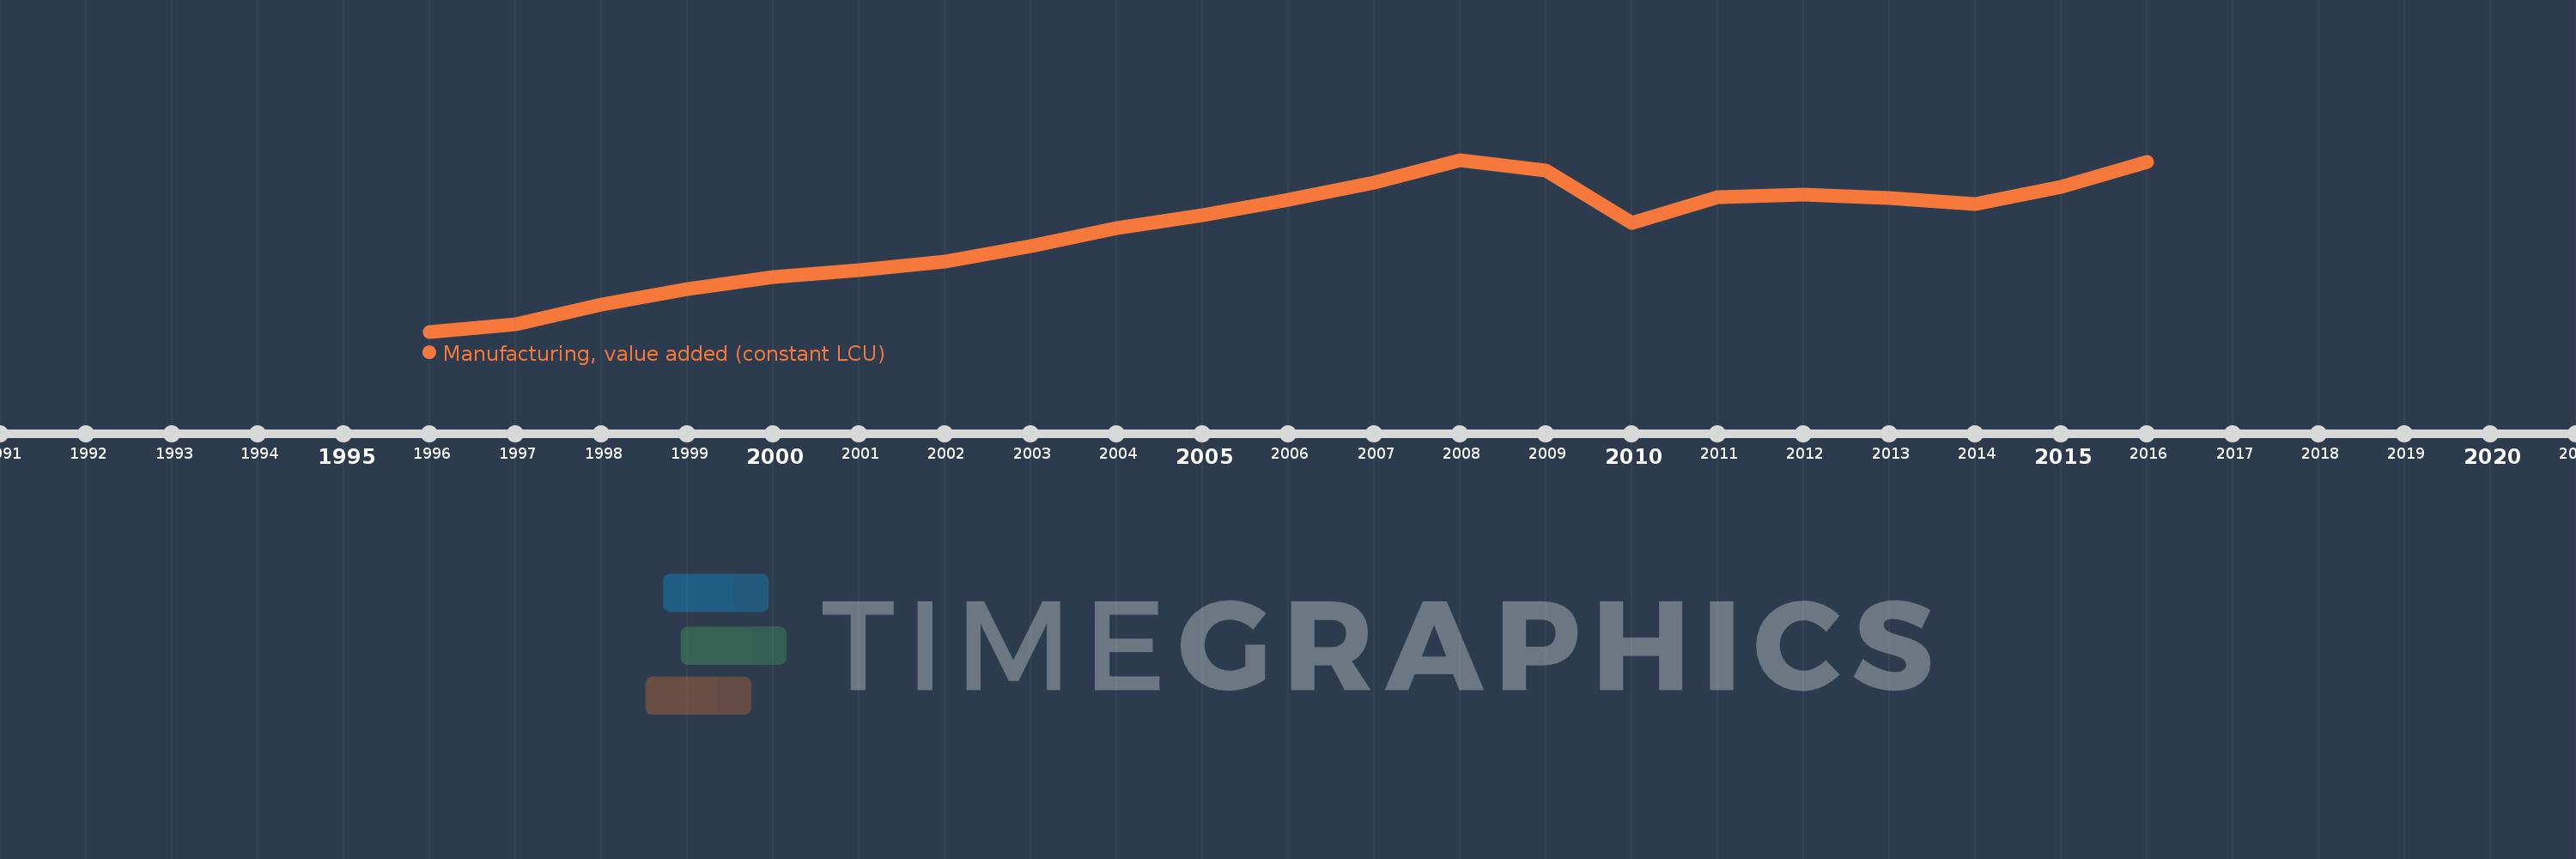
Manufacturing, value added (constant LCU)
2016,2015,2014,2013,2012,2011,2010,2009,2008,2007,2006,2005,2004,2003,2002,2001,2000,1999,1998,1997,1996
Queste statistiche in altri paesi:
AfghanistanAlbaniaAlgeriaAntigua and BarbudaArgentinaArmeniaAustraliaAustriaAzerbaijanBahamas, TheBahrainBangladeshBelarusBelgiumBelizeBeninBermudaBhutanBoliviaBosnia and HerzegovinaBotswanaBrazilBrunei DarussalamBurkina FasoBurundiCabo VerdeCambodiaCameroonCanadaCayman IslandsCentral African RepublicChadChileColombiaComorosCongo, Dem. Rep.Congo, Rep.Costa RicaCote d'IvoireCroatiaCubaCyprusCzech RepublicDenmarkDjiboutiDominicaDominican RepublicEcuadorEgypt, Arab Rep.El SalvadorEquatorial GuineaEritreaEstoniaEthiopiaFijiFinlandFranceGabonGambia, TheGeorgiaGermanyGhanaGreeceGrenadaGuatemalaGuineaGuyanaHaitiHondurasHong Kong SAR, ChinaHungaryIcelandIndiaIndonesiaIran, Islamic Rep.IraqIrelandItalyJamaicaJapanJordanKazakhstanKenyaKiribatiKorea, Rep.KosovoKuwaitKyrgyz RepublicLao PDRLatviaLebanonLesothoLiberiaLibyaLithuaniaLuxembourgMacedonia, FYRMadagascarMalawiMalaysiaMaldivesMarshall IslandsMauritaniaMauritiusMexicoMicronesia, Fed. Sts.MoldovaMongoliaMontenegroMoroccoMozambiqueMyanmarNamibiaNepalNetherlandsNew ZealandNicaraguaNigerNigeriaNorwayOmanPakistanPalauPanamaPapua New GuineaParaguayPeruPhilippinesPolandPortugalPuerto RicoQatarRomaniaRussian FederationRwandaSamoaSao Tome and PrincipeSaudi ArabiaSenegalSerbiaSeychellesSierra LeoneSingaporeSlovak RepublicSloveniaSolomon IslandsSomaliaSouth AfricaSpainSri LankaSt. Kitts and NevisSt. LuciaSt. Vincent and the GrenadinesSudanSurinameSwazilandSwedenSwitzerlandSyrian Arab RepublicTajikistanTanzaniaThailandTimor-LesteTogoTongaTrinidad and TobagoTunisiaTurkeyTuvaluUgandaUkraineUnited Arab EmiratesUnited KingdomUnited StatesUruguayUzbekistanVanuatuVenezuela, RBVietnamWest Bank and GazaZambiaZimbabwe Linea del tempo:
Questa scala temporale mostra un grafico dal 1996 anno al 2016 anno. Hungary. I dati fino ad 1995 anno non disponibili. Il numero di osservazioni attuali secondo i date: 21.
La fonte (nome):
Indicatori dello sviluppo mondiale
La fonte (organizzazione):
World Bank national accounts data, and OECD National Accounts data files.
Categorie:
Economy & Growth
sono stati aggiornati
23 apr 2017 anni
Indicatori delle variazioni dei valori per anni
Minima:
2.539 Trln
1 gen 1996 anni
Massimo:
5.626 Trln
1 gen 2008 anni
Alla data di osservazione
Valore
Variazione assoluta
La variazione rispetto al valore precedente
1 gen 1996 anni
2.539 Trln
+2.539 Trln
0.0%
1 gen 1997 anni
2.673 Trln
+133.363 Mlrd
5.25%
1 gen 1998 anni
3.024 Trln
+351.164 Mlrd
13.14%
1 gen 1999 anni
3.306 Trln
+282.71 Mlrd
9.35%
1 gen 2000 anni
3.512 Trln
+205.54 Mlrd
6.22%
1 gen 2001 anni
3.637 Trln
+124.755 Mlrd
3.55%
1 gen 2002 anni
3.803 Trln
+166.046 Mlrd
4.57%
1 gen 2003 anni
4.074 Trln
+270.678 Mlrd
7.12%
1 gen 2004 anni
4.393 Trln
+319.11 Mlrd
7.83%
1 gen 2005 anni
4.631 Trln
+237.995 Mlrd
5.42%
1 gen 2006 anni
4.902 Trln
+271.583 Mlrd
5.86%
1 gen 2007 anni
5.221 Trln
+318.716 Mlrd
6.5%
1 gen 2008 anni
5.626 Trln
+404.659 Mlrd
7.75%
1 gen 2009 anni
5.434 Trln
-191.234 Mlrd
-3.4%
1 gen 2010 anni
4.484 Trln
-950.517 Mlrd
-17.49%
1 gen 2011 anni
4.957 Trln
+472.709 Mlrd
10.54%
1 gen 2012 anni
5.002 Trln
+45.648 Mlrd
0.92%
1 gen 2013 anni
4.933 Trln
-68.974 Mlrd
-1.38%
1 gen 2014 anni
4.83 Trln
-103.243 Mlrd
-2.09%
1 gen 2015 anni
5.145 Trln
+315.298 Mlrd
6.53%
1 gen 2016 anni
5.591 Trln
+445.593 Mlrd
8.66%
Classificazione dei paesi secondo i statistiche attuali per anni


Commenti: