29
/it/
it
AIzaSyAYiBZKx7MnpbEhh9jyipgxe19OcubqV5w
April 1, 2024
148545
Guyana
GUY
true
2
1
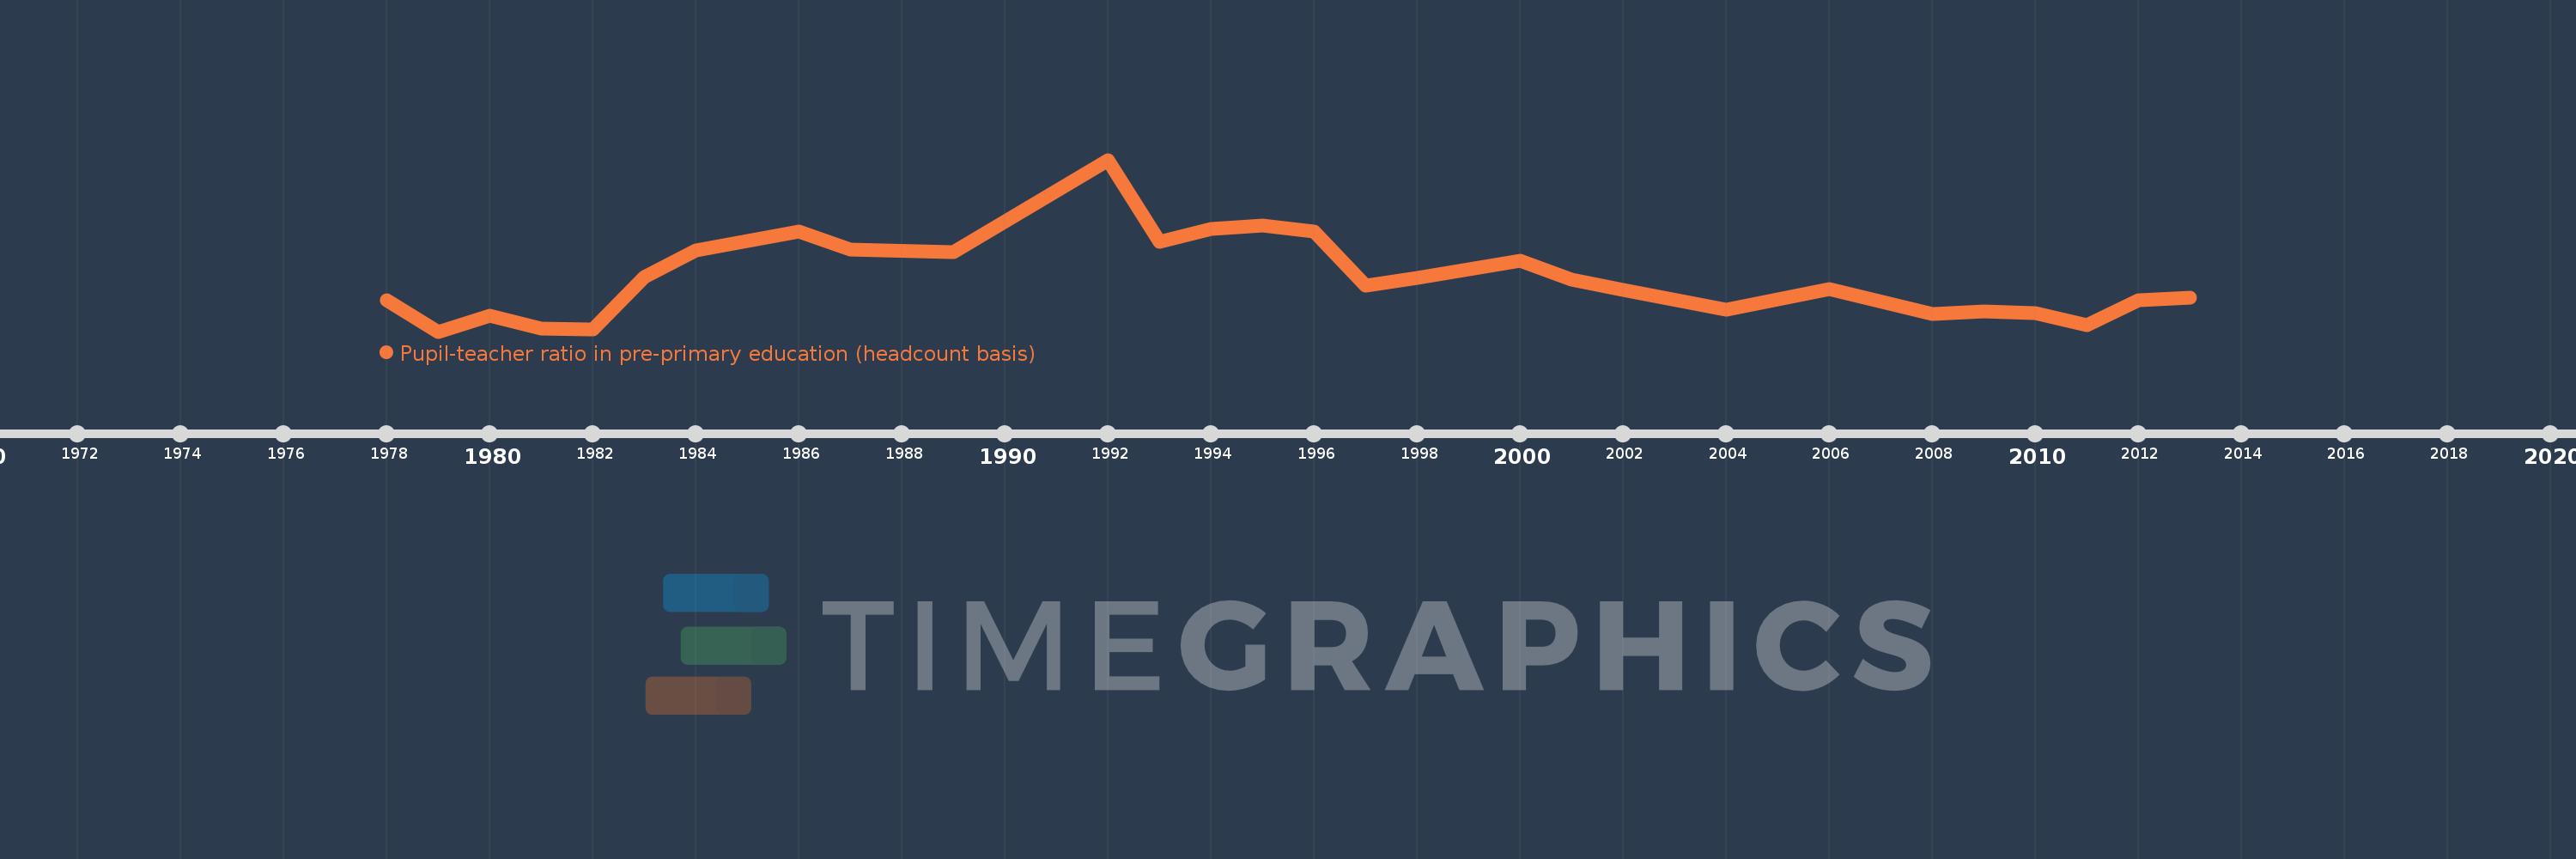
Pupil-teacher ratio in pre-primary education (headcount basis)
2013,2012,2011,2010,2009,2008,2006,2004,2002,2001,2000,1998,1997,1996,1995,1994,1993,1992,1989,1987,1986,1984,1983,1982,1981,1980,1979,1978
Queste statistiche in altri paesi:
AfghanistanAlbaniaAlgeriaAndorraAngolaAntigua and BarbudaArab WorldArgentinaArmeniaArubaAustriaAzerbaijanBahamas, TheBahrainBangladeshBarbadosBelarusBelgiumBelizeBeninBermudaBhutanBoliviaBosnia and HerzegovinaBotswanaBrazilBritish Virgin IslandsBrunei DarussalamBulgariaBurkina FasoBurundiCabo VerdeCambodiaCameroonCanadaCaribbean small statesCayman IslandsCentral African RepublicCentral Europe and the BalticsChadChileChinaColombiaComorosCongo, Dem. Rep.Congo, Rep.Costa RicaCote d'IvoireCroatiaCubaCyprusCzech RepublicDenmarkDjiboutiDominicaDominican RepublicEarly-demographic dividendEast Asia & PacificEast Asia & Pacific (excluding high income)East Asia & Pacific (IDA & IBRD countries)EcuadorEgypt, Arab Rep.El SalvadorEquatorial GuineaEritreaEstoniaEthiopiaEuro areaEurope & Central AsiaEurope & Central Asia (excluding high income)Europe & Central Asia (IDA & IBRD countries)European UnionFijiFinlandFragile and conflict affected situationsFranceGabonGambia, TheGeorgiaGermanyGhanaGibraltarGreeceGrenadaGuatemalaGuineaGuinea-BissauGuyanaHaitiHeavily indebted poor countries (HIPC)High incomeHondurasHong Kong SAR, ChinaHungaryIBRD onlyIcelandIDA & IBRD totalIDA blendIDA onlyIDA totalIndiaIndonesiaIran, Islamic Rep.IraqIrelandIsraelItalyJamaicaJapanJordanKazakhstanKenyaKorea, Dem. People’s Rep.Korea, Rep.KuwaitKyrgyz RepublicLao PDRLate-demographic dividendLatin America & Caribbean Latin America & Caribbean (excluding high income)Latin America & the Caribbean (IDA & IBRD countries)LatviaLeast developed countries: UN classificationLebanonLesothoLiberiaLibyaLiechtensteinLithuaniaLow & middle incomeLow incomeLower middle incomeLuxembourgMacao SAR, ChinaMacedonia, FYRMadagascarMalaysiaMaldivesMaliMaltaMarshall IslandsMauritaniaMauritiusMexicoMiddle East & North AfricaMiddle East & North Africa (excluding high income)Middle East & North Africa (IDA & IBRD countries)Middle incomeMoldovaMonacoMongoliaMontenegroMoroccoMozambiqueMyanmarNamibiaNauruNepalNetherlandsNew ZealandNicaraguaNigerNigeriaNorth AmericaNorwayOECD membersOmanOther small statesPacific island small statesPalauPanamaPapua New GuineaParaguayPeruPhilippinesPolandPortugalPost-demographic dividendPre-demographic dividendPuerto RicoQatarRomaniaRussian FederationRwandaSamoaSan MarinoSao Tome and PrincipeSaudi ArabiaSenegalSerbiaSeychellesSierra LeoneSingaporeSlovak RepublicSloveniaSmall statesSolomon IslandsSomaliaSouth AfricaSouth AsiaSouth Asia (IDA & IBRD)South SudanSpainSt. Kitts and NevisSt. LuciaSt. Vincent and the GrenadinesSub-Saharan Africa Sub-Saharan Africa (excluding high income)Sub-Saharan Africa (IDA & IBRD countries)SudanSurinameSwazilandSwedenSwitzerlandSyrian Arab RepublicTajikistanTanzaniaThailandTimor-LesteTogoTongaTrinidad and TobagoTunisiaTurkeyTurks and Caicos IslandsTuvaluUgandaUkraineUnited Arab EmiratesUnited KingdomUnited StatesUpper middle incomeUruguayUzbekistanVanuatuVenezuela, RBVietnamWest Bank and GazaWorldYemen, Rep.Zimbabwe Linea del tempo:
Questa scala temporale mostra un grafico dal 1978 anno al 2013 anno. Guyana. I dati fino ad 1977 anno non disponibili. Il numero di osservazioni attuali secondo i date: 28.
La fonte (nome):
Indicatori dello sviluppo mondiale
La fonte (organizzazione):
UNESCO Institute for Statistics
Categorie:
Education
sono stati aggiornati
23 apr 2017 anni
Indicatori delle variazioni dei valori per anni
Minima:
13.708
1 gen 1979 anni
Massimo:
23.487
1 gen 1992 anni
Alla data di osservazione
Valore
Variazione assoluta
La variazione rispetto al valore precedente
1 gen 1978 anni
15.514
+15.514
0.0%
1 gen 1979 anni
13.708
-1.805
-11.64%
1 gen 1980 anni
14.599
+0.89
6.49%
1 gen 1981 anni
13.898
-0.7
-4.8%
1 gen 1982 anni
13.853
-0.045
-0.33%
1 gen 1983 anni
16.802
+2.949
21.29%
1 gen 1984 anni
18.316
+1.514
9.01%
1 gen 1986 anni
19.427
+1.111
6.06%
1 gen 1987 anni
18.36
-1.067
-5.49%
1 gen 1989 anni
18.229
-0.131
-0.71%
1 gen 1992 anni
23.487
+5.258
28.84%
1 gen 1993 anni
18.813
-4.674
-19.9%
1 gen 1994 anni
19.557
+0.744
3.96%
1 gen 1995 anni
19.759
+0.201
1.03%
1 gen 1996 anni
19.42
-0.339
-1.71%
1 gen 1997 anni
16.326
-3.094
-15.93%
1 gen 1998 anni
16.786
+0.46
2.82%
1 gen 2000 anni
17.737
+0.951
5.66%
1 gen 2001 anni
16.653
-1.084
-6.11%
1 gen 2002 anni
16.065
-0.588
-3.53%
1 gen 2004 anni
14.955
-1.11
-6.91%
1 gen 2006 anni
16.134
+1.179
7.88%
1 gen 2008 anni
14.718
-1.416
-8.78%
1 gen 2009 anni
14.878
+0.16
1.09%
1 gen 2010 anni
14.75
-0.128
-0.86%
1 gen 2011 anni
14.064
-0.686
-4.65%
1 gen 2012 anni
15.475
+1.411
10.03%
1 gen 2013 anni
15.632
+0.157
1.01%
Classificazione dei paesi secondo i statistiche attuali per anni


Commenti: