Download Queste statistiche in altri paesi:
Linea del tempo:
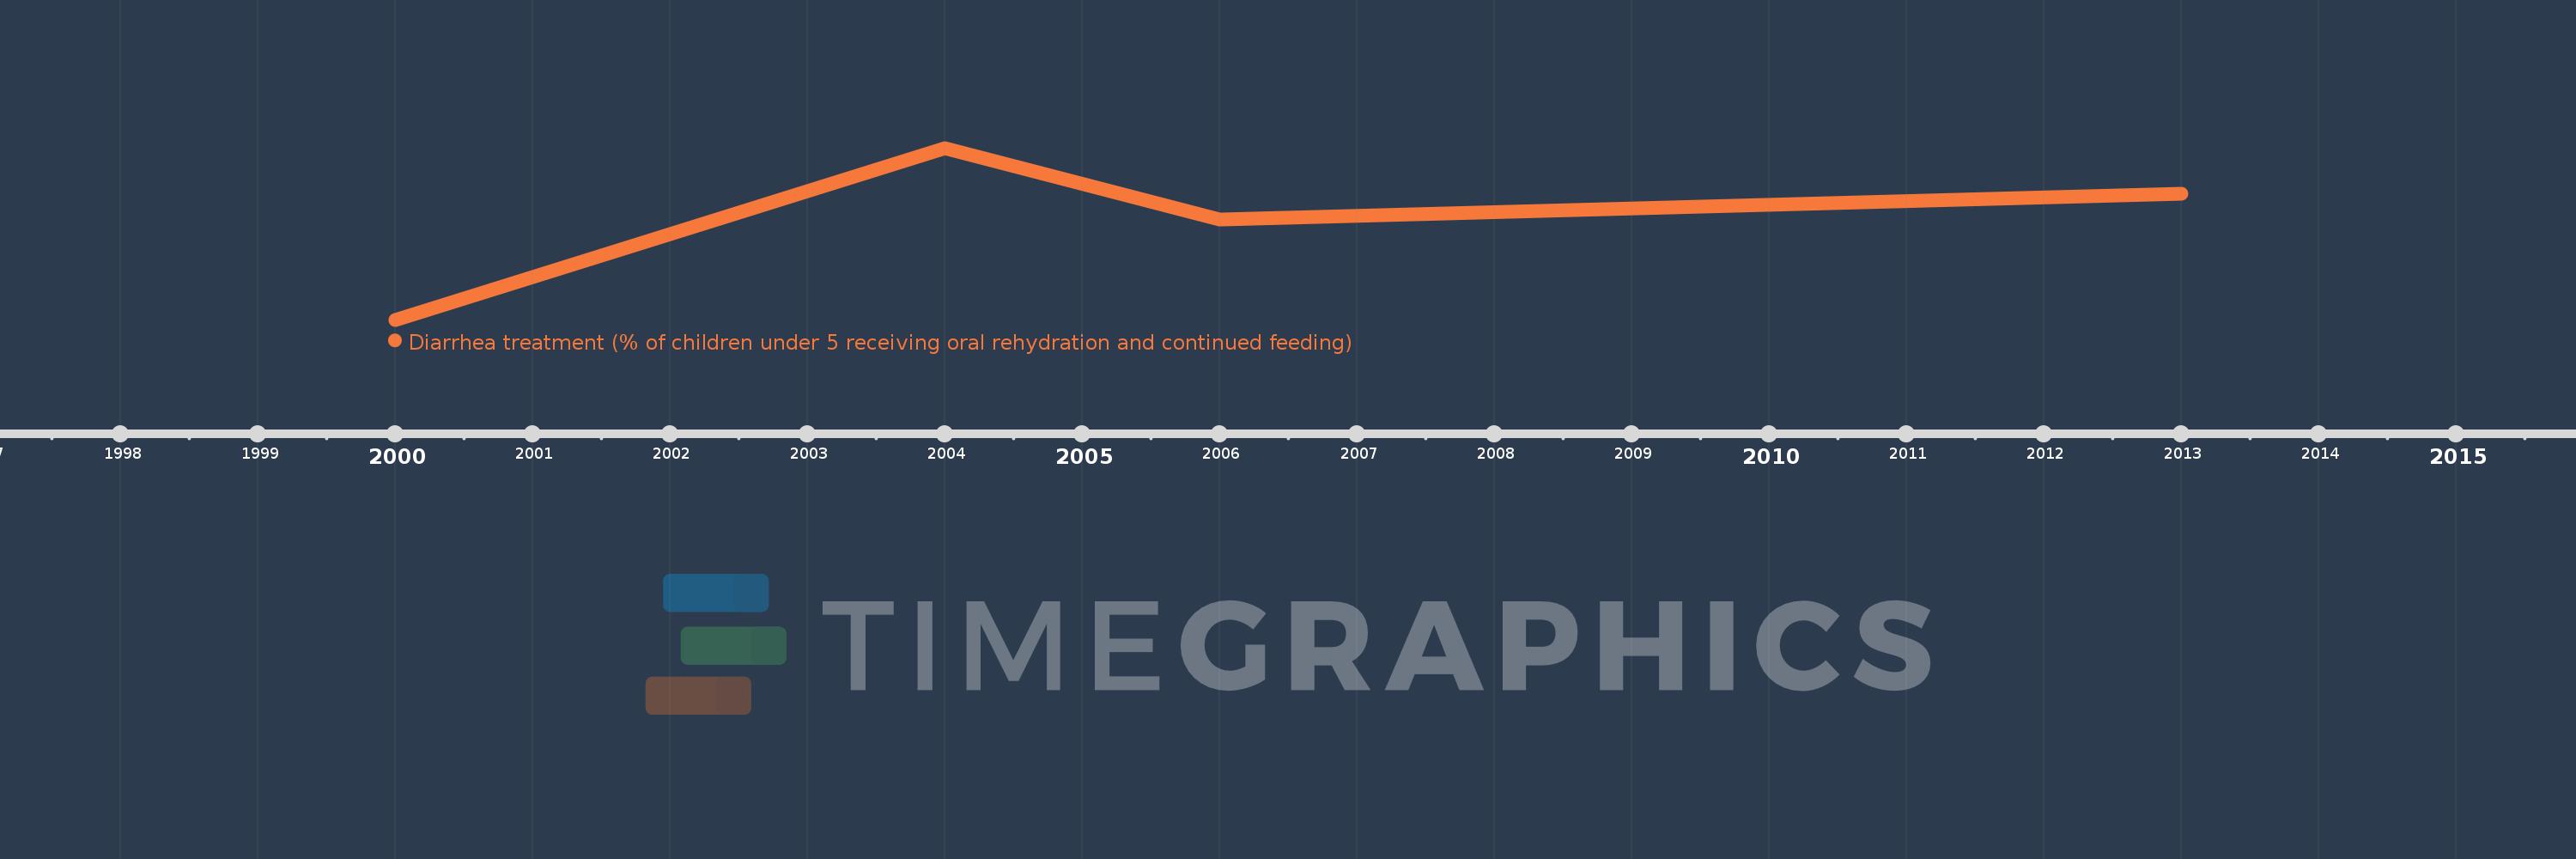
Questa scala temporale mostra un grafico dal 2000 anno al 2013 anno. Guinea. I dati fino ad 1999 anno non disponibili. Il numero di osservazioni attuali secondo i date: 4.
La fonte (nome):
Indicatori dello sviluppo mondiale
La fonte (organizzazione):
UNICEF, State of the World's Children, Childinfo, and Demographic and Health Surveys.
Categorie:
Health
sono stati aggiornati
23 apr 2017 anni
Indicatori delle variazioni dei valori per anni
Minima:
28.6
1 gen 2000 anni
Massimo:
44.0
1 gen 2004 anni
Alla data di osservazione
Valore
Variazione assoluta
La variazione rispetto al valore precedente
1 gen 2000 anni
28.6
+28.6
0.0%
1 gen 2004 anni
44.0
+15.4
53.85%
1 gen 2006 anni
37.6
-6.4
-14.55%
1 gen 2013 anni
39.9
+2.3
6.12%
Classificazione dei paesi secondo i statistiche attuali per anni
