29
/it/
it
AIzaSyAYiBZKx7MnpbEhh9jyipgxe19OcubqV5w
April 1, 2024
144791
Guatemala
GTM
true
2
1
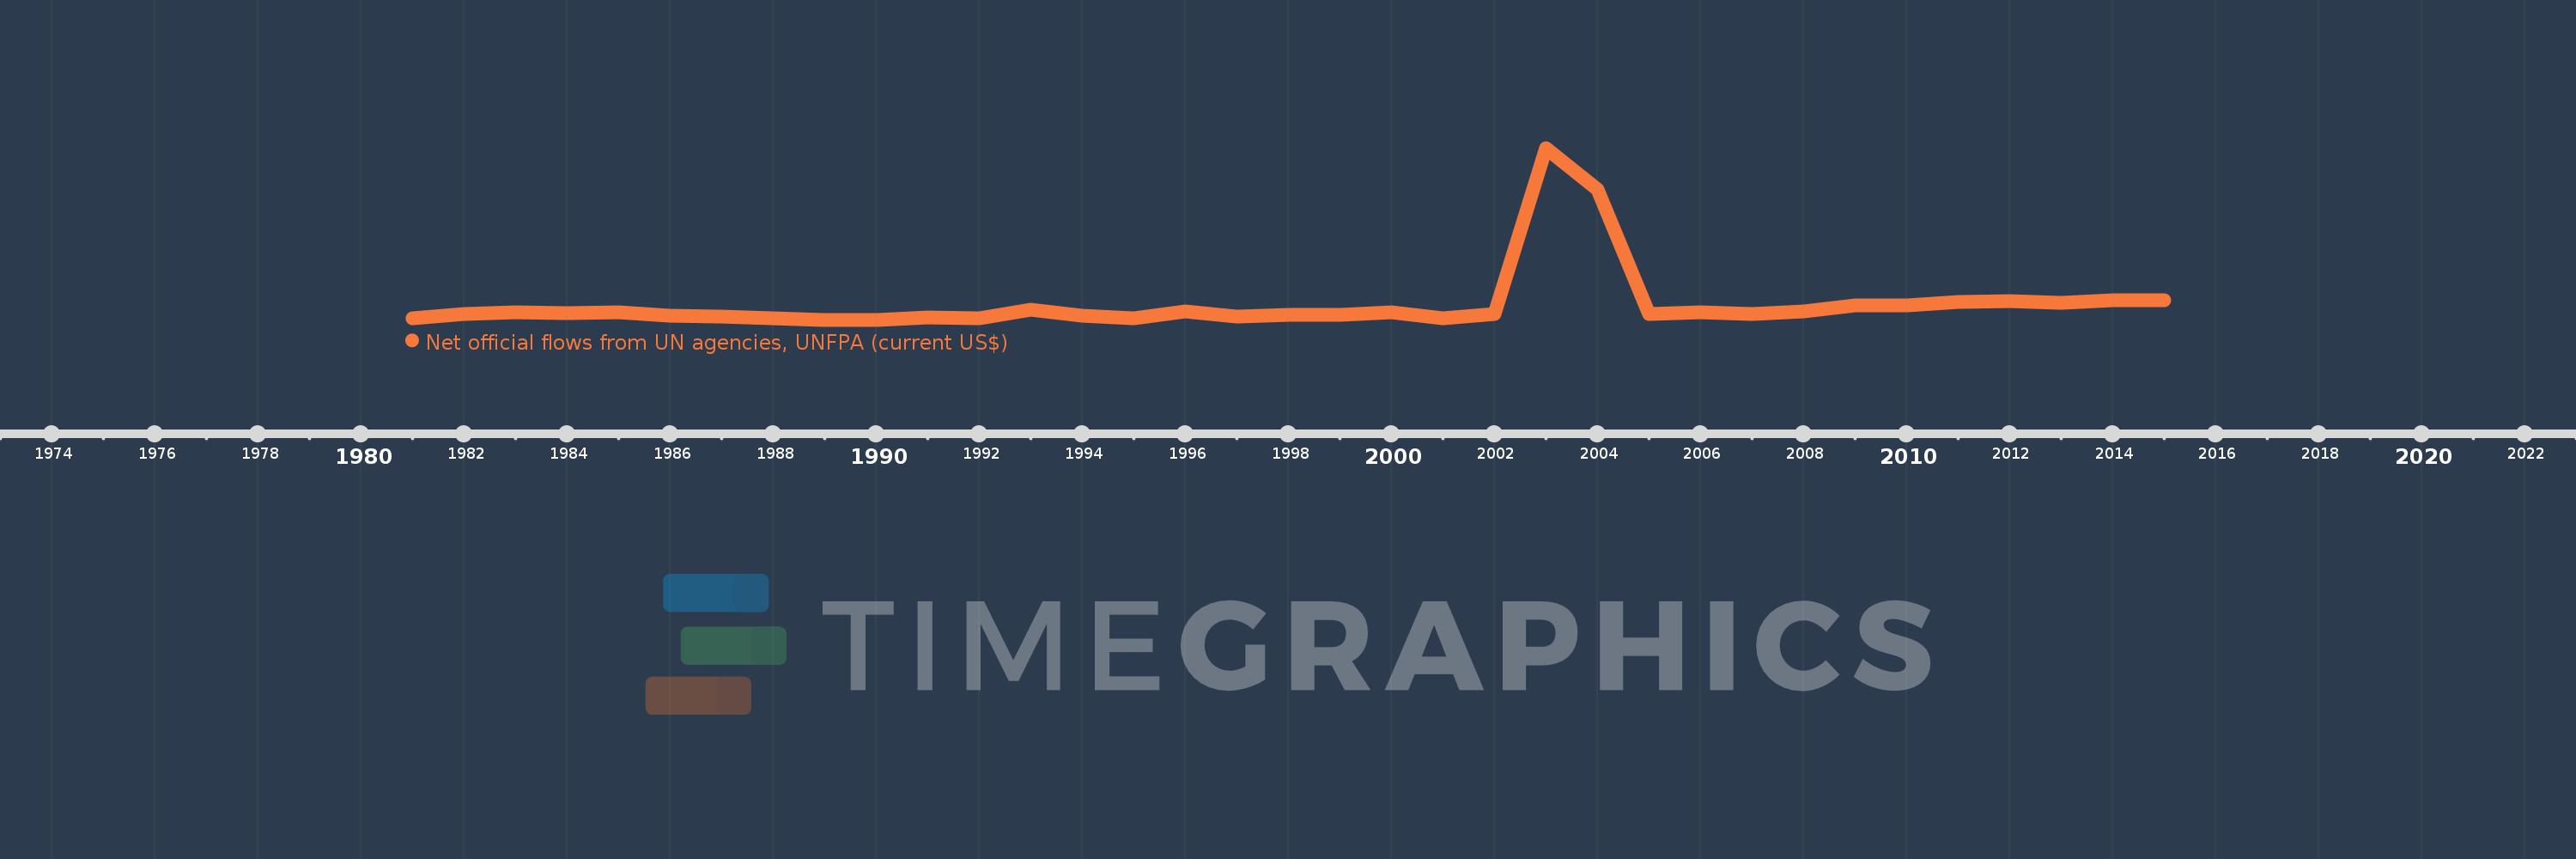
Net official flows from UN agencies, UNFPA (current US$)
2015,2014,2013,2012,2011,2010,2009,2008,2007,2006,2005,2004,2003,2002,2001,2000,1999,1998,1997,1996,1995,1994,1993,1992,1991,1990,1989,1988,1987,1986,1985,1984,1983,1982,1981
Queste statistiche in altri paesi:
AfghanistanAlbaniaAlgeriaAngolaAntigua and BarbudaArab WorldArgentinaArmeniaAzerbaijanBahamas, TheBahrainBangladeshBarbadosBelarusBelizeBeninBermudaBhutanBoliviaBosnia and HerzegovinaBotswanaBrazilBritish Virgin IslandsBulgariaBurkina FasoBurundiCabo VerdeCambodiaCameroonCaribbean small statesCayman IslandsCentral African RepublicCentral Europe and the BalticsChadChileChinaColombiaComorosCongo, Dem. Rep.Congo, Rep.Costa RicaCote d'IvoireCroatiaCubaCyprusDjiboutiDominicaDominican RepublicEast Asia & PacificEast Asia & Pacific (excluding high income)East Asia & Pacific (IDA & IBRD countries)EcuadorEgypt, Arab Rep.El SalvadorEquatorial GuineaEritreaEstoniaEthiopiaEuro areaEurope & Central AsiaEurope & Central Asia (excluding high income)Europe & Central Asia (IDA & IBRD countries)European UnionFijiFragile and conflict affected situationsGabonGambia, TheGeorgiaGhanaGrenadaGuatemalaGuineaGuinea-BissauGuyanaHaitiHeavily indebted poor countries (HIPC)High incomeHondurasHong Kong SAR, ChinaHungaryIBRD onlyIDA & IBRD totalIDA blendIDA onlyIDA totalIndiaIndonesiaIran, Islamic Rep.IraqJamaicaJordanKazakhstanKenyaKiribatiKorea, Dem. People’s Rep.Korea, Rep.KosovoKuwaitKyrgyz RepublicLao PDRLatin America & Caribbean Latin America & Caribbean (excluding high income)Latin America & the Caribbean (IDA & IBRD countries)LatviaLeast developed countries: UN classificationLebanonLesothoLiberiaLibyaLithuaniaLow & middle incomeLow incomeLower middle incomeMacedonia, FYRMadagascarMalawiMalaysiaMaldivesMaliMaltaMarshall IslandsMauritaniaMauritiusMexicoMicronesia, Fed. Sts.Middle East & North AfricaMiddle East & North Africa (excluding high income)Middle East & North Africa (IDA & IBRD countries)Middle incomeMoldovaMongoliaMontenegroMoroccoMozambiqueMyanmarNamibiaNepalNicaraguaNigerNigeriaNorth AmericaNorthern Mariana IslandsOECD membersOmanOther small statesPacific island small statesPakistanPalauPanamaPapua New GuineaParaguayPeruPhilippinesPolandQatarRomaniaRussian FederationRwandaSamoaSao Tome and PrincipeSaudi ArabiaSenegalSerbiaSeychellesSierra LeoneSingaporeSmall statesSolomon IslandsSomaliaSouth AfricaSouth AsiaSouth Asia (IDA & IBRD)South SudanSri LankaSt. Kitts and NevisSt. LuciaSt. Vincent and the GrenadinesSub-Saharan Africa Sub-Saharan Africa (excluding high income)Sub-Saharan Africa (IDA & IBRD countries)SudanSurinameSwazilandSyrian Arab RepublicTajikistanTanzaniaThailandTimor-LesteTogoTongaTrinidad and TobagoTunisiaTurkeyTurkmenistanTurks and Caicos IslandsTuvaluUgandaUkraineUnited Arab EmiratesUpper middle incomeUruguayUzbekistanVanuatuVenezuela, RBVietnamWest Bank and GazaWorldYemen, Rep.ZambiaZimbabwe Linea del tempo:
Questa scala temporale mostra un grafico dal 1981 anno al 2015 anno. Guatemala. I dati fino ad 1980 anno non disponibili. Il numero di osservazioni attuali secondo i date: 35.
La fonte (nome):
Indicatori dello sviluppo mondiale
La fonte (organizzazione):
Development Assistance Committee of the Organisation for Economic Co-operation and Development, Geographical Distribution of Financial Flows to Developing Countries, Development Co-operation Report, and International Development Statistics database. Data are available online at: www.oecd.org/dac/stats/idsonline.
Categorie:
Aid Effectiveness
sono stati aggiornati
23 apr 2017 anni
Indicatori delle variazioni dei valori per anni
Minima:
160.0 Mille.
1 gen 1989 anni
Massimo:
13.46 Mln
1 gen 2003 anni
Alla data di osservazione
Valore
Variazione assoluta
La variazione rispetto al valore precedente
1 gen 1981 anni
300.0 Mille.
+300.0 Mille.
0.0%
1 gen 1982 anni
630.0 Mille.
+330.0 Mille.
110.0%
1 gen 1983 anni
730.0 Mille.
+100.0 Mille.
15.87%
1 gen 1984 anni
700.0 Mille.
-30.0 Mille.
-4.11%
1 gen 1985 anni
750.0 Mille.
+50.0 Mille.
7.14%
1 gen 1986 anni
500.0 Mille.
-250.0 Mille.
-33.33%
1 gen 1987 anni
410.0 Mille.
-90.0 Mille.
-18.0%
1 gen 1988 anni
260.0 Mille.
-150.0 Mille.
-36.59%
1 gen 1989 anni
160.0 Mille.
-100.0 Mille.
-38.46%
1 gen 1990 anni
160.0 Mille.
0.0
0.0%
1 gen 1991 anni
320.0 Mille.
+160.0 Mille.
100.0%
1 gen 1992 anni
300.0 Mille.
-20.0 Mille.
-6.25%
1 gen 1993 anni
940.0 Mille.
+640.0 Mille.
213.33%
1 gen 1994 anni
500.0 Mille.
-440.0 Mille.
-46.81%
1 gen 1995 anni
250.0 Mille.
-250.0 Mille.
-50.0%
1 gen 1996 anni
780.0 Mille.
+530.0 Mille.
212.0%
1 gen 1997 anni
390.0 Mille.
-390.0 Mille.
-50.0%
1 gen 1998 anni
570.0 Mille.
+180.0 Mille.
46.15%
1 gen 1999 anni
540.0 Mille.
-30.0 Mille.
-5.26%
1 gen 2000 anni
730.0 Mille.
+190.0 Mille.
35.19%
1 gen 2001 anni
270.0 Mille.
-460.0 Mille.
-63.01%
1 gen 2002 anni
610.0 Mille.
+340.0 Mille.
125.93%
1 gen 2003 anni
13.46 Mln
+12.85 Mln
2.11 Mille.%
1 gen 2004 anni
10.27 Mln
-3.19 Mln
-23.7%
1 gen 2005 anni
580.0 Mille.
-9.69 Mln
-94.35%
1 gen 2006 anni
710.0 Mille.
+130.0 Mille.
22.41%
1 gen 2007 anni
600.0 Mille.
-110.0 Mille.
-15.49%
1 gen 2008 anni
800.0 Mille.
+200.0 Mille.
33.33%
1 gen 2009 anni
1.29 Mln
+490.0 Mille.
61.25%
1 gen 2010 anni
1.29 Mln
0.0
0.0%
1 gen 2011 anni
1.54 Mln
+250.0 Mille.
19.38%
1 gen 2012 anni
1.63 Mln
+90.0 Mille.
5.84%
1 gen 2013 anni
1.47 Mln
-160.0 Mille.
-9.82%
1 gen 2014 anni
1.68 Mln
+210.0 Mille.
14.29%
1 gen 2015 anni
1.69 Mln
+10.0 Mille.
0.6%
Classificazione dei paesi secondo i statistiche attuali per anni


Commenti: