29
/it/
it
AIzaSyAYiBZKx7MnpbEhh9jyipgxe19OcubqV5w
April 1, 2024
139888
Germany
DEU
true
2
1
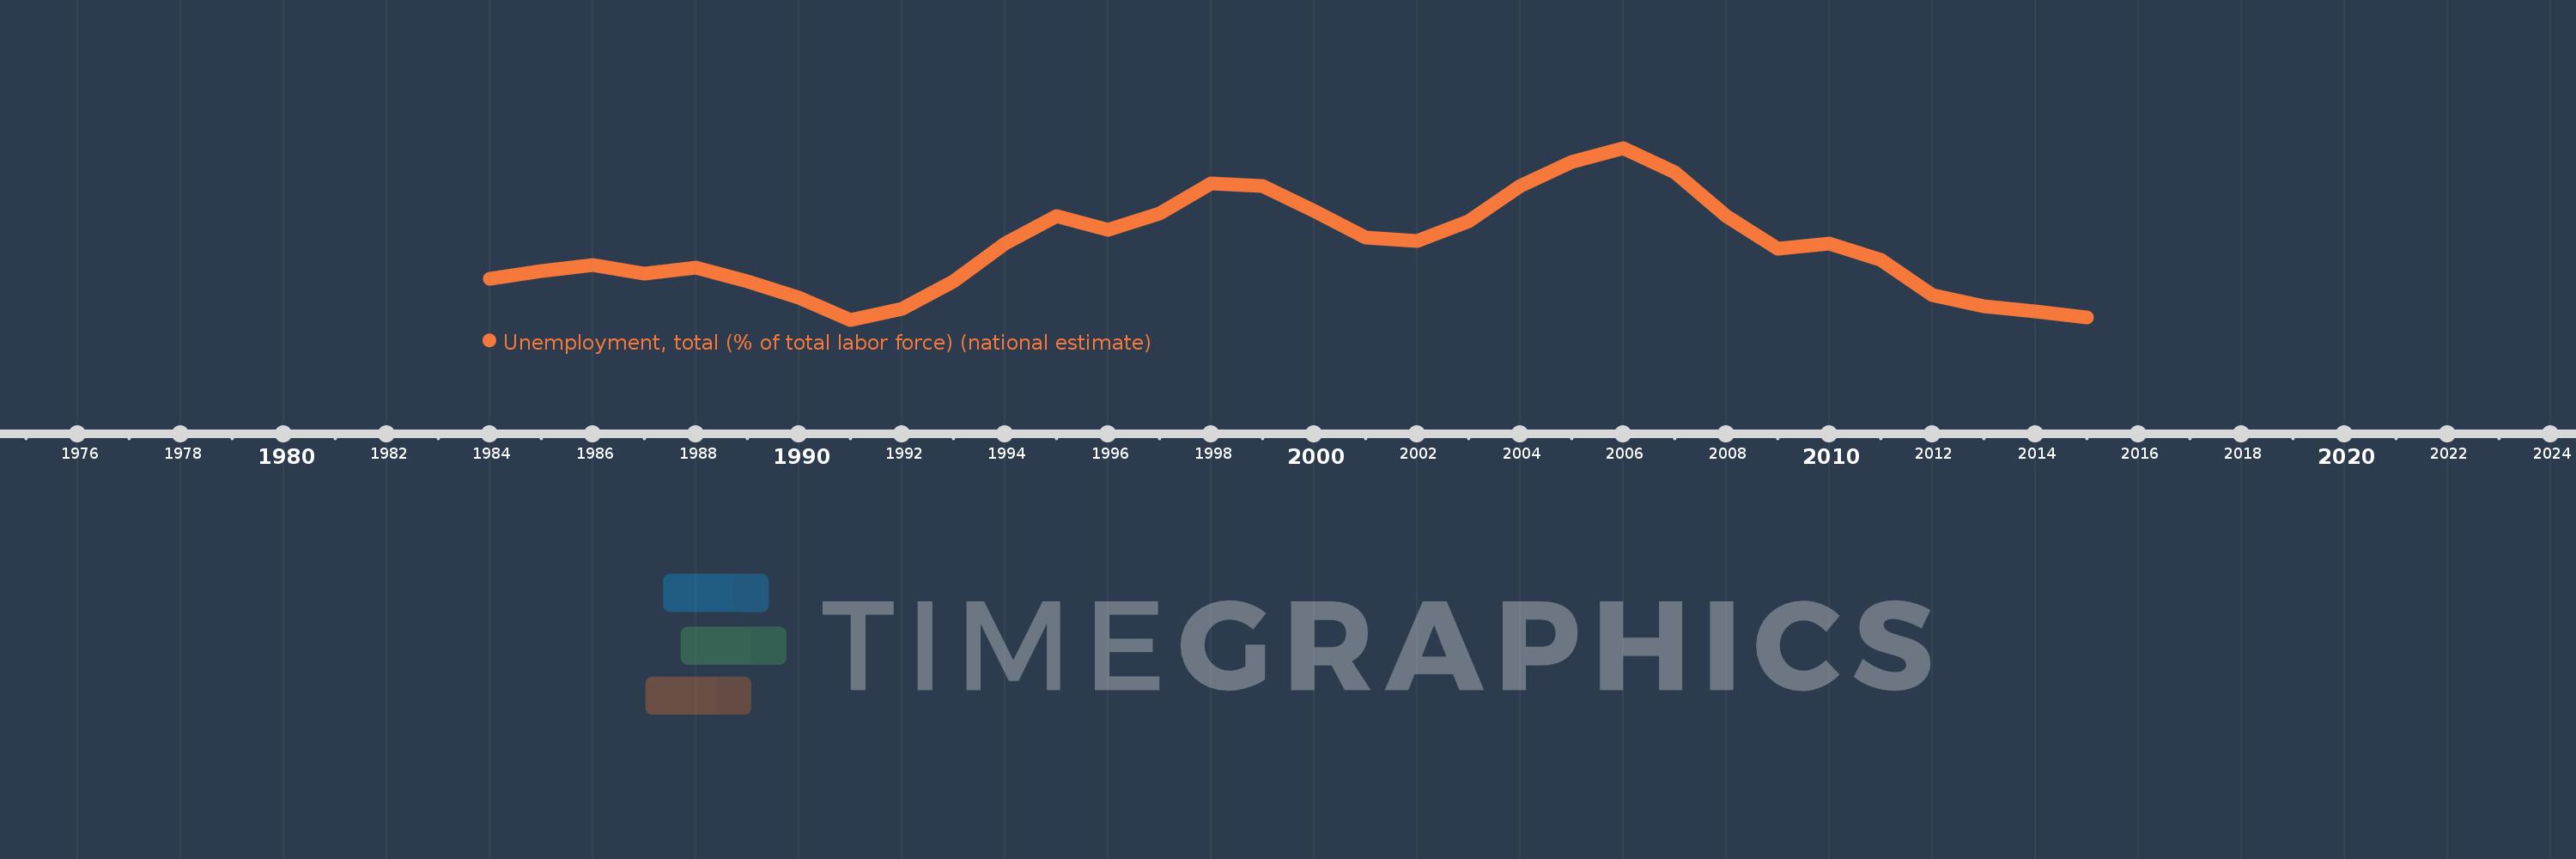
Unemployment, total (% of total labor force) (national estimate)
2015,2014,2013,2012,2011,2010,2009,2008,2007,2006,2005,2004,2003,2002,2001,2000,1999,1998,1997,1996,1995,1994,1993,1992,1991,1990,1989,1988,1987,1986,1985,1984
Queste statistiche in altri paesi:
AfghanistanAlbaniaAlgeriaAmerican SamoaAntigua and BarbudaArab WorldArgentinaArmeniaArubaAustraliaAustriaAzerbaijanBahamas, TheBahrainBangladeshBarbadosBelarusBelgiumBelizeBeninBermudaBhutanBoliviaBosnia and HerzegovinaBotswanaBrazilBritish Virgin IslandsBrunei DarussalamBulgariaBurkina FasoBurundiCabo VerdeCambodiaCameroonCanadaCaribbean small statesCayman IslandsCentral Europe and the BalticsChadChileChinaColombiaComorosCongo, Dem. Rep.Costa RicaCote d'IvoireCroatiaCubaCyprusCzech RepublicDenmarkDjiboutiDominicaDominican RepublicEarly-demographic dividendEast Asia & PacificEast Asia & Pacific (excluding high income)East Asia & Pacific (IDA & IBRD countries)EcuadorEgypt, Arab Rep.El SalvadorEquatorial GuineaEstoniaEthiopiaEuro areaEurope & Central AsiaEurope & Central Asia (excluding high income)Europe & Central Asia (IDA & IBRD countries)European UnionFaroe IslandsFijiFinlandFranceFrench PolynesiaGabonGambia, TheGeorgiaGermanyGhanaGibraltarGreeceGreenlandGrenadaGuamGuatemalaGuineaGuyanaHaitiHigh incomeHondurasHong Kong SAR, ChinaHungaryIBRD onlyIcelandIDA & IBRD totalIDA blendIndiaIndonesiaIran, Islamic Rep.IraqIrelandIsle of ManIsraelItalyJamaicaJapanJordanKazakhstanKenyaKiribatiKorea, Rep.KosovoKuwaitKyrgyz RepublicLao PDRLate-demographic dividendLatin America & Caribbean Latin America & Caribbean (excluding high income)Latin America & the Caribbean (IDA & IBRD countries)LatviaLebanonLesothoLiberiaLibyaLiechtensteinLithuaniaLow & middle incomeLower middle incomeLuxembourgMacao SAR, ChinaMacedonia, FYRMadagascarMalawiMalaysiaMaldivesMaliMaltaMarshall IslandsMauritaniaMauritiusMexicoMiddle East & North AfricaMiddle East & North Africa (excluding high income)Middle East & North Africa (IDA & IBRD countries)Middle incomeMoldovaMonacoMongoliaMontenegroMoroccoMozambiqueMyanmarNamibiaNauruNepalNetherlandsNew CaledoniaNew ZealandNicaraguaNigerNigeriaNorth AmericaNorthern Mariana IslandsNorwayOECD membersPakistanPalauPanamaPapua New GuineaParaguayPeruPhilippinesPolandPortugalPost-demographic dividendPuerto RicoQatarRomaniaRussian FederationRwandaSamoaSan MarinoSao Tome and PrincipeSaudi ArabiaSenegalSerbiaSeychellesSierra LeoneSingaporeSlovak RepublicSloveniaSolomon IslandsSouth AfricaSouth AsiaSouth Asia (IDA & IBRD)South SudanSpainSri LankaSt. Kitts and NevisSt. LuciaSt. Vincent and the GrenadinesSudanSurinameSwazilandSwedenSwitzerlandSyrian Arab RepublicTajikistanTanzaniaThailandTimor-LesteTongaTrinidad and TobagoTunisiaTurkeyTurks and Caicos IslandsTuvaluUgandaUkraineUnited Arab EmiratesUnited KingdomUnited StatesUpper middle incomeUruguayVanuatuVenezuela, RBVietnamWest Bank and GazaWorldYemen, Rep.ZambiaZimbabwe Linea del tempo:
Questa scala temporale mostra un grafico dal 1984 anno al 2015 anno. Germany. I dati fino ad 1983 anno non disponibili. Il numero di osservazioni attuali secondo i date: 32.
La fonte (nome):
Indicatori dello sviluppo mondiale
La fonte (organizzazione):
International Labour Organization, Key Indicators of the Labour Market database.
Categorie:
Social Protection & Labor
sono stati aggiornati
23 apr 2017 anni
Indicatori delle variazioni dei valori per anni
Minima:
4.9
1 gen 1991 anni
Massimo:
11.2
1 gen 2006 anni
Alla data di osservazione
Valore
Variazione assoluta
La variazione rispetto al valore precedente
1 gen 1984 anni
6.4
+6.4
0.0%
1 gen 1985 anni
6.7
+0.3
4.69%
1 gen 1986 anni
6.9
+0.2
2.99%
1 gen 1987 anni
6.6
-0.3
-4.35%
1 gen 1988 anni
6.8
+0.2
3.03%
1 gen 1989 anni
6.3
-0.5
-7.35%
1 gen 1990 anni
5.7
-0.6
-9.52%
1 gen 1991 anni
4.9
-0.8
-14.04%
1 gen 1992 anni
5.3
+0.4
8.16%
1 gen 1993 anni
6.3
+1.0
18.87%
1 gen 1994 anni
7.7
+1.4
22.22%
1 gen 1995 anni
8.7
+1.0
12.99%
1 gen 1996 anni
8.2
-0.5
-5.75%
1 gen 1997 anni
8.8
+0.6
7.32%
1 gen 1998 anni
9.9
+1.1
12.5%
1 gen 1999 anni
9.8
-0.1
-1.01%
1 gen 2000 anni
8.9
-0.9
-9.18%
1 gen 2001 anni
7.9
-1.0
-11.24%
1 gen 2002 anni
7.8
-0.1
-1.27%
1 gen 2003 anni
8.5
+0.7
8.97%
1 gen 2004 anni
9.8
+1.3
15.29%
1 gen 2005 anni
10.7
+0.9
9.18%
1 gen 2006 anni
11.2
+0.5
4.67%
1 gen 2007 anni
10.3
-0.9
-8.04%
1 gen 2008 anni
8.7
-1.6
-15.53%
1 gen 2009 anni
7.5
-1.2
-13.79%
1 gen 2010 anni
7.7
+0.2
2.67%
1 gen 2011 anni
7.1
-0.6
-7.79%
1 gen 2012 anni
5.8
-1.3
-18.31%
1 gen 2013 anni
5.4
-0.4
-6.9%
1 gen 2014 anni
5.2
-0.2
-3.7%
1 gen 2015 anni
5.0
-0.2
-3.85%
Classificazione dei paesi secondo i statistiche attuali per anni


Commenti: