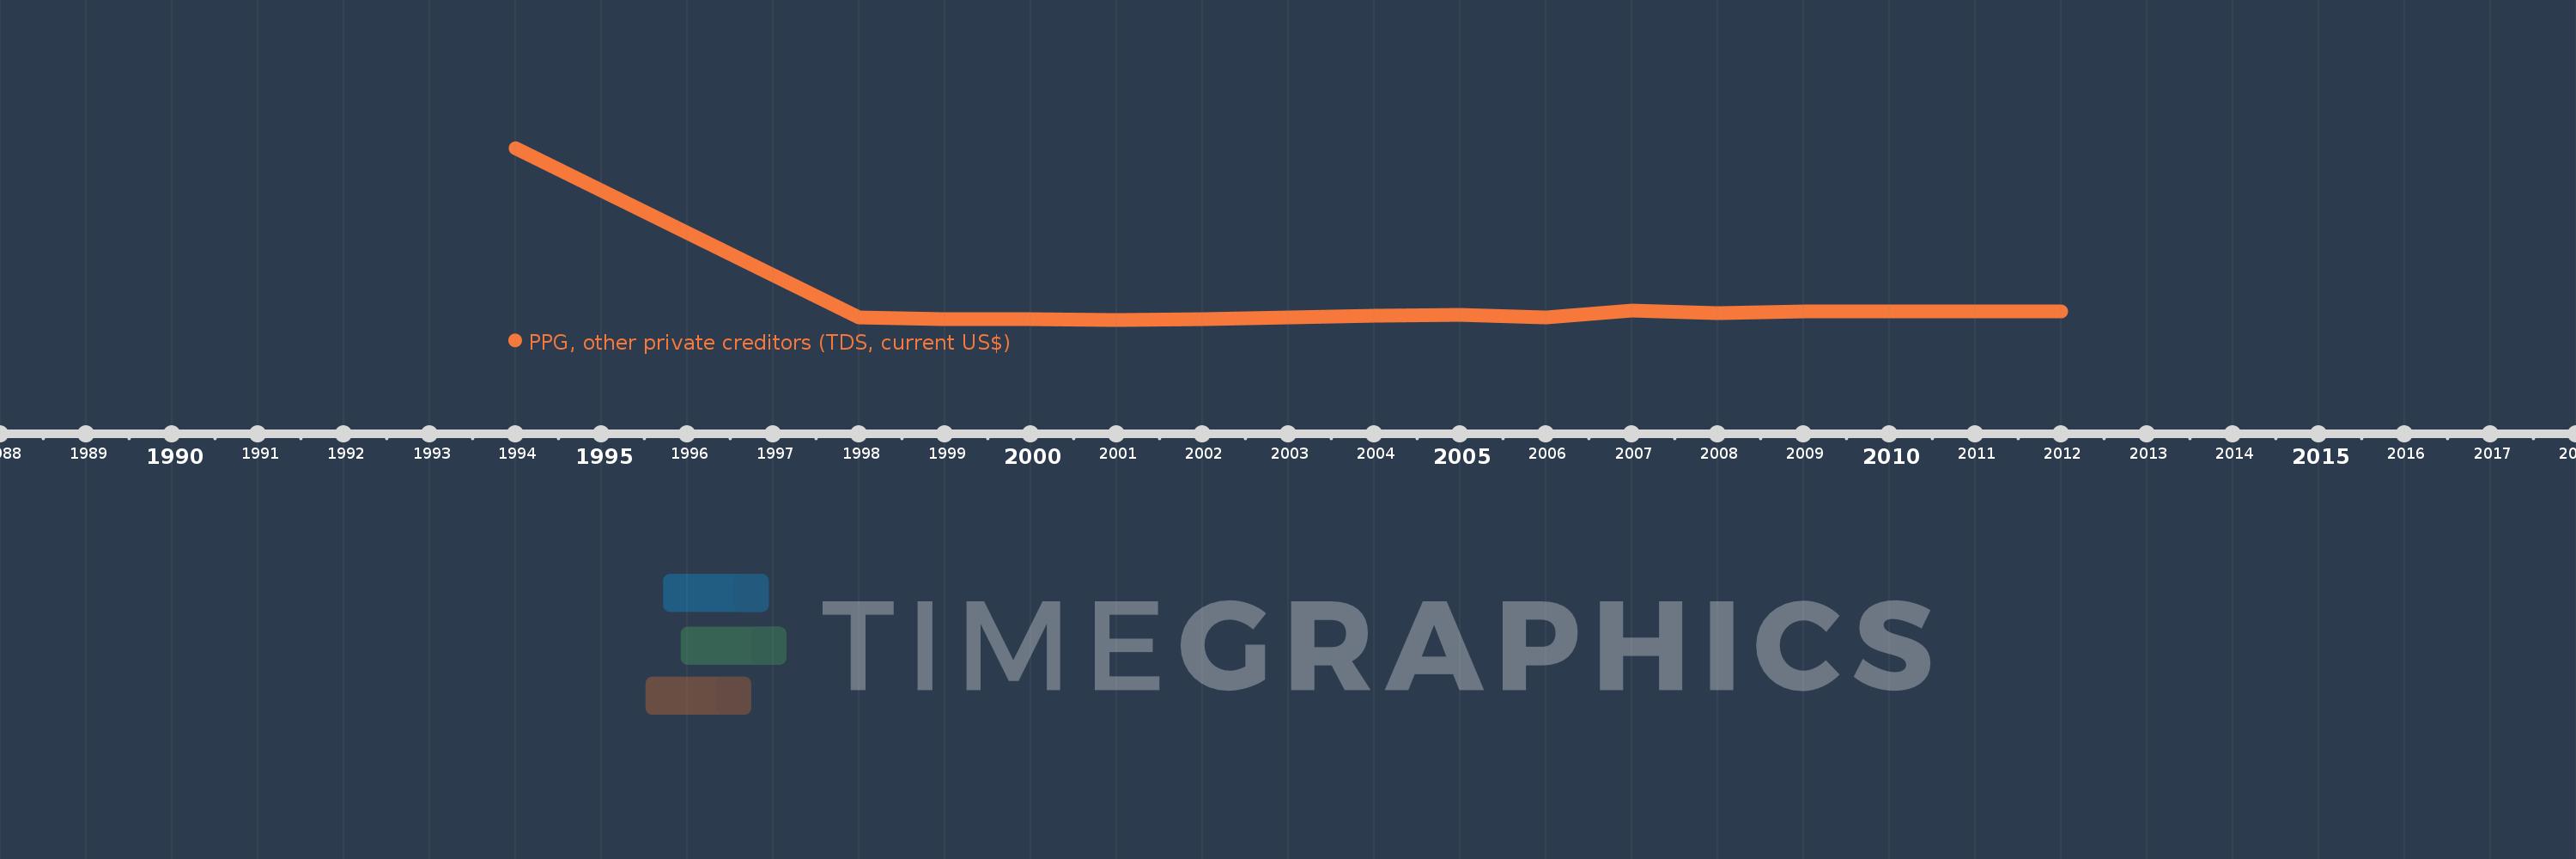
Questa scala temporale mostra un grafico dal 1994 anno al 2012 anno. Georgia. I dati fino ad 1993 anno non disponibili. Il numero di osservazioni attuali secondo i date: 16.
La fonte (nome):
Indicatori dello sviluppo mondiale
La fonte (organizzazione):
World Bank, International Debt Statistics.
Categorie:
External Debt
sono stati aggiornati
23 apr 2017 anni
Indicatori delle variazioni dei valori per anni
In media:
791.5 Mille.
Minima:
90.0 Mille.
1 gen 2001 anni
Massimo:
8.22 Mln
1 gen 1994 anni
Alla data di osservazione
Valore
Variazione assoluta
La variazione rispetto al valore precedente
1 gen 1994 anni
8.22 Mln
+8.22 Mln
0.0%
1 gen 1998 anni
191.0 Mille.
-8.029 Mln
-97.68%
1 gen 1999 anni
108.0 Mille.
-83.0 Mille.
-43.46%
1 gen 2000 anni
105.0 Mille.
-3.0 Mille.
-2.78%
1 gen 2001 anni
90.0 Mille.
-15.0 Mille.
-14.29%
1 gen 2002 anni
131.0 Mille.
+41.0 Mille.
45.56%
1 gen 2003 anni
199.0 Mille.
+68.0 Mille.
51.91%
1 gen 2004 anni
263.0 Mille.
+64.0 Mille.
32.16%
1 gen 2005 anni
313.0 Mille.
+50.0 Mille.
19.01%
1 gen 2006 anni
189.0 Mille.
-124.0 Mille.
-39.62%
1 gen 2007 anni
515.0 Mille.
+326.0 Mille.
172.49%
1 gen 2008 anni
419.0 Mille.
-96.0 Mille.
-18.64%
1 gen 2009 anni
482.0 Mille.
+63.0 Mille.
15.04%
1 gen 2010 anni
471.0 Mille.
-11.0 Mille.
-2.28%
1 gen 2011 anni
466.0 Mille.
-5.0 Mille.
-1.06%
1 gen 2012 anni
502.0 Mille.
+36.0 Mille.
7.73%
Classificazione dei paesi secondo i statistiche attuali per anni
