29
/it/
it
AIzaSyAYiBZKx7MnpbEhh9jyipgxe19OcubqV5w
April 1, 2024
131369
Faroe Islands
FRO
true
2
1
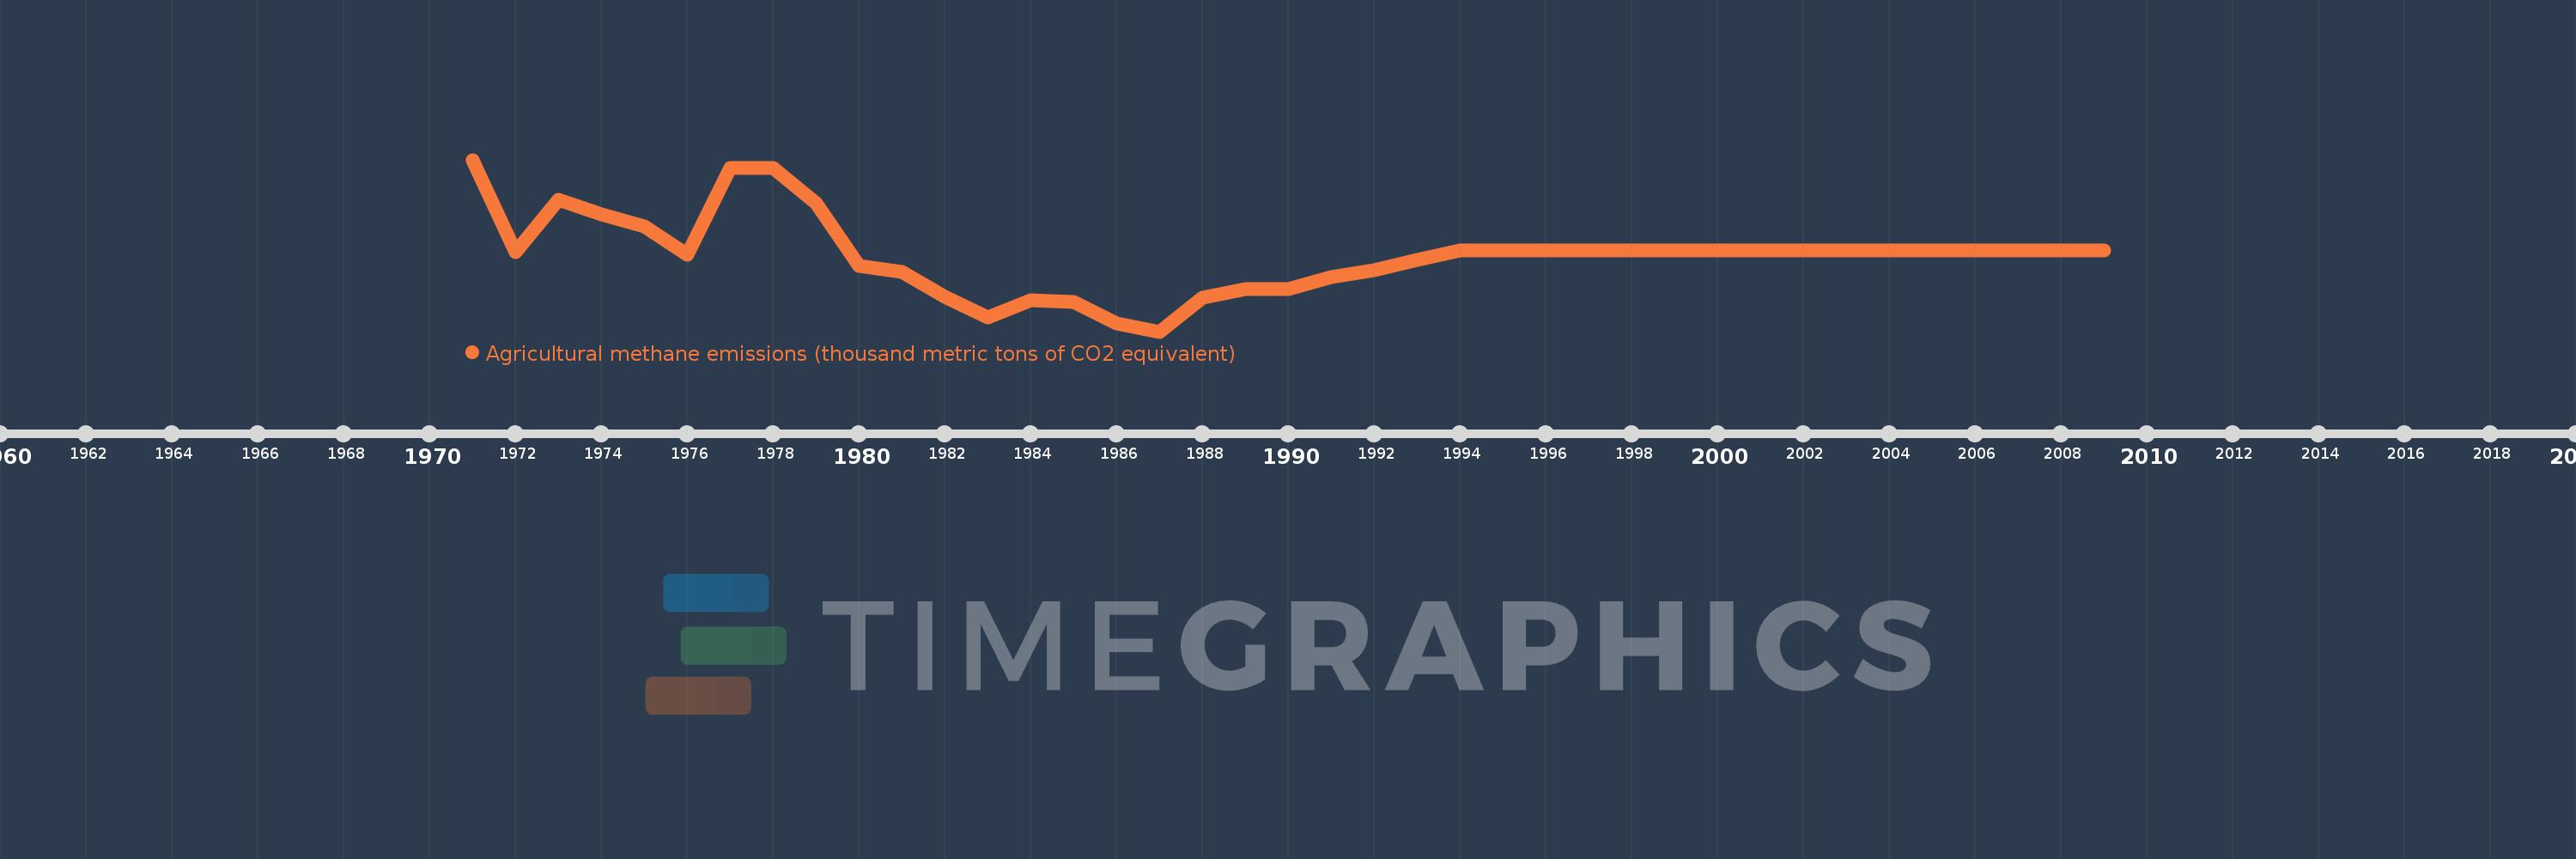
Agricultural methane emissions (thousand metric tons of CO2 equivalent)
2009,2008,2007,2006,2005,2004,2003,2002,2001,2000,1999,1998,1997,1996,1995,1994,1993,1992,1991,1990,1989,1988,1987,1986,1985,1984,1983,1982,1981,1980,1979,1978,1977,1976,1975,1974,1973,1972,1971
Queste statistiche in altri paesi:
AfghanistanAlbaniaAlgeriaAmerican SamoaAndorraAngolaAntigua and BarbudaArab WorldArgentinaArmeniaArubaAustraliaAustriaAzerbaijanBahamas, TheBahrainBangladeshBarbadosBelarusBelgiumBelizeBeninBermudaBhutanBoliviaBosnia and HerzegovinaBotswanaBrazilBritish Virgin IslandsBrunei DarussalamBulgariaBurkina FasoBurundiCabo VerdeCambodiaCameroonCanadaCaribbean small statesCayman IslandsCentral African RepublicCentral Europe and the BalticsChadChannel IslandsChileChinaColombiaComorosCongo, Dem. Rep.Congo, Rep.Costa RicaCote d'IvoireCroatiaCubaCuracaoCyprusCzech RepublicDenmarkDjiboutiDominicaDominican RepublicEarly-demographic dividendEast Asia & PacificEast Asia & Pacific (excluding high income)East Asia & Pacific (IDA & IBRD countries)EcuadorEgypt, Arab Rep.El SalvadorEquatorial GuineaEritreaEstoniaEthiopiaEuro areaEurope & Central AsiaEurope & Central Asia (excluding high income)Europe & Central Asia (IDA & IBRD countries)European UnionFaroe IslandsFijiFinlandFragile and conflict affected situationsFranceFrench PolynesiaGabonGambia, TheGeorgiaGermanyGhanaGibraltarGreeceGreenlandGrenadaGuamGuatemalaGuineaGuinea-BissauGuyanaHaitiHeavily indebted poor countries (HIPC)High incomeHondurasHong Kong SAR, ChinaHungaryIBRD onlyIcelandIDA & IBRD totalIDA blendIDA onlyIDA totalIndiaIndonesiaIran, Islamic Rep.IraqIrelandIsle of ManIsraelItalyJamaicaJapanJordanKazakhstanKenyaKiribatiKorea, Dem. People’s Rep.Korea, Rep.KosovoKuwaitKyrgyz RepublicLao PDRLate-demographic dividendLatin America & Caribbean Latin America & Caribbean (excluding high income)Latin America & the Caribbean (IDA & IBRD countries)LatviaLeast developed countries: UN classificationLebanonLesothoLiberiaLibyaLiechtensteinLithuaniaLow & middle incomeLow incomeLower middle incomeLuxembourgMacao SAR, ChinaMacedonia, FYRMadagascarMalawiMalaysiaMaldivesMaliMaltaMarshall IslandsMauritaniaMauritiusMexicoMicronesia, Fed. Sts.Middle East & North AfricaMiddle East & North Africa (excluding high income)Middle East & North Africa (IDA & IBRD countries)Middle incomeMoldovaMonacoMongoliaMontenegroMoroccoMozambiqueMyanmarNamibiaNauruNepalNetherlandsNew CaledoniaNew ZealandNicaraguaNigerNigeriaNorth AmericaNorthern Mariana IslandsNorwayOECD membersOmanOther small statesPacific island small statesPakistanPalauPanamaPapua New GuineaParaguayPeruPhilippinesPolandPortugalPost-demographic dividendPre-demographic dividendPuerto RicoQatarRomaniaRussian FederationRwandaSamoaSan MarinoSao Tome and PrincipeSaudi ArabiaSenegalSerbiaSeychellesSierra LeoneSingaporeSint Maarten (Dutch part)Slovak RepublicSloveniaSmall statesSolomon IslandsSomaliaSouth AfricaSouth AsiaSouth Asia (IDA & IBRD)South SudanSpainSri LankaSt. Kitts and NevisSt. LuciaSt. Martin (French part)St. Vincent and the GrenadinesSub-Saharan Africa Sub-Saharan Africa (excluding high income)Sub-Saharan Africa (IDA & IBRD countries)SudanSurinameSwazilandSwedenSwitzerlandSyrian Arab RepublicTajikistanTanzaniaThailandTimor-LesteTogoTongaTrinidad and TobagoTunisiaTurkeyTurkmenistanTurks and Caicos IslandsTuvaluUgandaUkraineUnited Arab EmiratesUnited KingdomUnited StatesUpper middle incomeUruguayUzbekistanVanuatuVenezuela, RBVietnamVirgin Islands (U.S.)West Bank and GazaWorldYemen, Rep.ZambiaZimbabwe Linea del tempo:
Questa scala temporale mostra un grafico dal 1971 anno al 2009 anno. Faroe Islands. I dati fino ad 1970 anno non disponibili. Il numero di osservazioni attuali secondo i date: 39.
La fonte (nome):
Indicatori dello sviluppo mondiale
La fonte (organizzazione):
European Commission, Joint Research Centre (JRC)/Netherlands Environmental Assessment Agency (PBL). Emission Database for Global Atmospheric Research (EDGAR): http://edgar.jrc.ec.europa.eu/
Categorie:
Agriculture & Rural Development, Environment
sono stati aggiornati
23 apr 2017 anni
Indicatori delle variazioni dei valori per anni
Minima:
12.822
1 gen 1987 anni
Massimo:
14.065
1 gen 1971 anni
Alla data di osservazione
Valore
Variazione assoluta
La variazione rispetto al valore precedente
1 gen 1971 anni
14.065
+14.065
0.0%
1 gen 1972 anni
13.399
-0.666
-4.74%
1 gen 1973 anni
13.774
+0.375
2.8%
1 gen 1974 anni
13.671
-0.103
-0.75%
1 gen 1975 anni
13.582
-0.09
-0.65%
1 gen 1976 anni
13.38
-0.201
-1.48%
1 gen 1977 anni
14.005
+0.625
4.67%
1 gen 1978 anni
14.005
0.0
0.0%
1 gen 1979 anni
13.752
-0.253
-1.81%
1 gen 1980 anni
13.296
-0.455
-3.31%
1 gen 1981 anni
13.253
-0.043
-0.33%
1 gen 1982 anni
13.071
-0.182
-1.38%
1 gen 1983 anni
12.926
-0.144
-1.11%
1 gen 1984 anni
13.049
+0.123
0.95%
1 gen 1985 anni
13.034
-0.015
-0.11%
1 gen 1986 anni
12.88
-0.154
-1.18%
1 gen 1987 anni
12.822
-0.058
-0.45%
1 gen 1988 anni
13.067
+0.245
1.91%
1 gen 1989 anni
13.132
+0.064
0.49%
1 gen 1990 anni
13.132
0.0
0.0%
1 gen 1991 anni
13.218
+0.086
0.65%
1 gen 1992 anni
13.269
+0.052
0.39%
1 gen 1993 anni
13.338
+0.069
0.52%
1 gen 1994 anni
13.407
+0.069
0.52%
1 gen 1995 anni
13.407
0.0
0.0%
1 gen 1996 anni
13.407
0.0
0.0%
1 gen 1997 anni
13.407
0.0
0.0%
1 gen 1998 anni
13.407
0.0
0.0%
1 gen 1999 anni
13.407
0.0
0.0%
1 gen 2000 anni
13.407
0.0
0.0%
1 gen 2001 anni
13.407
0.0
0.0%
1 gen 2002 anni
13.407
0.0
0.0%
1 gen 2003 anni
13.407
0.0
0.0%
1 gen 2004 anni
13.407
0.0
0.0%
1 gen 2005 anni
13.407
0.0
0.0%
1 gen 2006 anni
13.407
0.0
0.0%
1 gen 2007 anni
13.407
0.0
0.0%
1 gen 2008 anni
13.407
0.0
0.0%
1 gen 2009 anni
13.407
0.0
0.0%
Classificazione dei paesi secondo i statistiche attuali per anni


Commenti: