29
/it/
it
AIzaSyAYiBZKx7MnpbEhh9jyipgxe19OcubqV5w
April 1, 2024
130944
Ethiopia
ETH
true
2
1
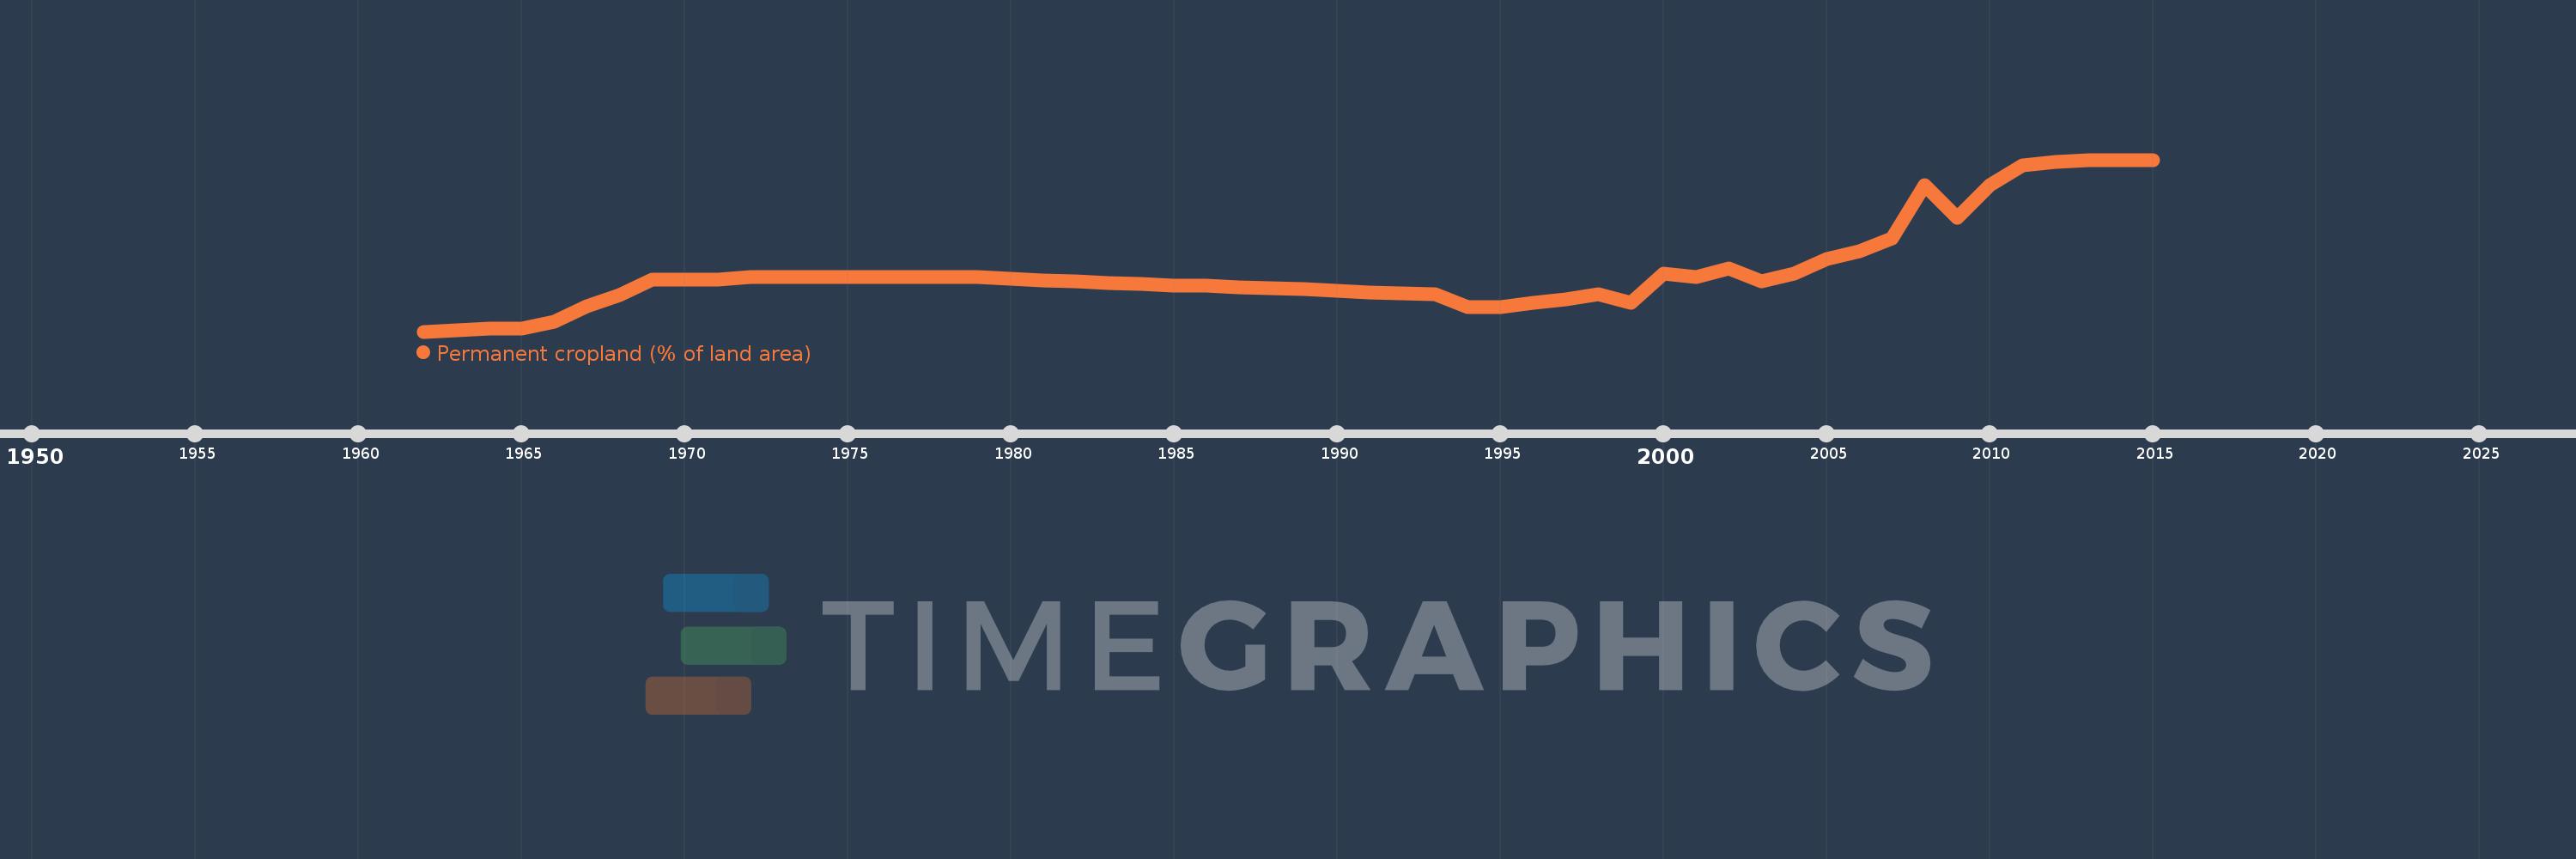
Permanent cropland (% of land area)
2015,2014,2013,2012,2011,2010,2009,2008,2007,2006,2005,2004,2003,2002,2001,2000,1999,1998,1997,1996,1995,1994,1993,1992,1991,1990,1989,1988,1987,1986,1985,1984,1983,1982,1981,1980,1979,1978,1977,1976,1975,1974,1973,1972,1971,1970,1969,1968,1967,1966,1965,1964,1963,1962
Queste statistiche in altri paesi:
AfghanistanAlbaniaAlgeriaAmerican SamoaAngolaAntigua and BarbudaArab WorldArgentinaArmeniaAustraliaAustriaAzerbaijanBahamas, TheBahrainBangladeshBarbadosBelarusBelgiumBelizeBeninBhutanBoliviaBosnia and HerzegovinaBotswanaBrazilBritish Virgin IslandsBrunei DarussalamBulgariaBurkina FasoBurundiCabo VerdeCambodiaCameroonCanadaCaribbean small statesCayman IslandsCentral African RepublicCentral Europe and the BalticsChadChileChinaColombiaComorosCongo, Dem. Rep.Congo, Rep.Costa RicaCote d'IvoireCroatiaCubaCyprusCzech RepublicDenmarkDominicaDominican RepublicEarly-demographic dividendEast Asia & PacificEast Asia & Pacific (excluding high income)East Asia & Pacific (IDA & IBRD countries)EcuadorEgypt, Arab Rep.El SalvadorEquatorial GuineaEritreaEstoniaEthiopiaEuro areaEurope & Central AsiaEurope & Central Asia (excluding high income)Europe & Central Asia (IDA & IBRD countries)European UnionFijiFinlandFragile and conflict affected situationsFranceFrench PolynesiaGabonGambia, TheGeorgiaGermanyGhanaGreeceGrenadaGuamGuatemalaGuineaGuinea-BissauGuyanaHaitiHeavily indebted poor countries (HIPC)High incomeHondurasHong Kong SAR, ChinaHungaryIBRD onlyIDA & IBRD totalIDA blendIDA onlyIDA totalIndiaIndonesiaIran, Islamic Rep.IraqIrelandIsraelItalyJamaicaJapanJordanKazakhstanKenyaKiribatiKorea, Dem. People’s Rep.Korea, Rep.KuwaitKyrgyz RepublicLao PDRLate-demographic dividendLatin America & Caribbean Latin America & Caribbean (excluding high income)Latin America & the Caribbean (IDA & IBRD countries)LatviaLeast developed countries: UN classificationLebanonLesothoLiberiaLibyaLithuaniaLow & middle incomeLow incomeLower middle incomeLuxembourgMacedonia, FYRMadagascarMalawiMalaysiaMaldivesMaliMaltaMarshall IslandsMauritaniaMauritiusMexicoMicronesia, Fed. Sts.Middle East & North AfricaMiddle East & North Africa (excluding high income)Middle East & North Africa (IDA & IBRD countries)Middle incomeMoldovaMongoliaMontenegroMoroccoMozambiqueMyanmarNamibiaNauruNepalNetherlandsNew CaledoniaNew ZealandNicaraguaNigerNigeriaNorth AmericaNorthern Mariana IslandsNorwayOECD membersOmanOther small statesPacific island small statesPakistanPalauPanamaPapua New GuineaParaguayPeruPhilippinesPolandPortugalPost-demographic dividendPre-demographic dividendPuerto RicoQatarRomaniaRussian FederationRwandaSamoaSao Tome and PrincipeSaudi ArabiaSenegalSerbiaSeychellesSierra LeoneSingaporeSlovak RepublicSloveniaSmall statesSolomon IslandsSomaliaSouth AfricaSouth AsiaSouth Asia (IDA & IBRD)SpainSri LankaSt. Kitts and NevisSt. LuciaSt. Vincent and the GrenadinesSub-Saharan Africa Sub-Saharan Africa (excluding high income)Sub-Saharan Africa (IDA & IBRD countries)SudanSurinameSwazilandSwedenSwitzerlandSyrian Arab RepublicTajikistanTanzaniaThailandTimor-LesteTogoTongaTrinidad and TobagoTunisiaTurkeyTurkmenistanTuvaluUgandaUkraineUnited Arab EmiratesUnited KingdomUnited StatesUpper middle incomeUruguayUzbekistanVanuatuVenezuela, RBVietnamVirgin Islands (U.S.)West Bank and GazaWorldYemen, Rep.ZambiaZimbabwe Linea del tempo:
Questa scala temporale mostra un grafico dal 1962 anno al 2015 anno. Ethiopia. I dati fino ad 1961 anno non disponibili. Il numero di osservazioni attuali secondo i date: 54.
La fonte (nome):
Indicatori dello sviluppo mondiale
La fonte (organizzazione):
Food and Agriculture Organization, electronic files and web site.
Categorie:
Agriculture & Rural Development
sono stati aggiornati
23 apr 2017 anni
Indicatori delle variazioni dei valori per anni
Minima:
0.441
1 gen 1962 anni
Massimo:
1.142
1 gen 2013 anni
Alla data di osservazione
Valore
Variazione assoluta
La variazione rispetto al valore precedente
1 gen 1962 anni
0.441
+0.441
0.0%
1 gen 1963 anni
0.445
+0.004
0.82%
1 gen 1964 anni
0.453
+0.008
1.84%
1 gen 1965 anni
0.453
0.0
0.0%
1 gen 1966 anni
0.481
+0.028
6.21%
1 gen 1967 anni
0.545
+0.064
13.21%
1 gen 1968 anni
0.59
+0.045
8.33%
1 gen 1969 anni
0.654
+0.064
10.77%
1 gen 1970 anni
0.654
0.0
0.0%
1 gen 1971 anni
0.654
0.0
0.0%
1 gen 1972 anni
0.663
+0.009
1.39%
1 gen 1973 anni
0.663
0.0
0.0%
1 gen 1974 anni
0.663
0.0
0.0%
1 gen 1975 anni
0.663
0.0
0.0%
1 gen 1976 anni
0.663
0.0
0.0%
1 gen 1977 anni
0.663
0.0
0.0%
1 gen 1978 anni
0.663
0.0
0.0%
1 gen 1979 anni
0.662
-0.001
-0.14%
1 gen 1980 anni
0.656
-0.006
-0.96%
1 gen 1981 anni
0.649
-0.006
-0.97%
1 gen 1982 anni
0.645
-0.005
-0.7%
1 gen 1983 anni
0.64
-0.005
-0.7%
1 gen 1984 anni
0.634
-0.006
-0.99%
1 gen 1985 anni
0.627
-0.007
-1.15%
1 gen 1986 anni
0.627
0.0
0.0%
1 gen 1987 anni
0.622
-0.005
-0.72%
1 gen 1988 anni
0.618
-0.005
-0.73%
1 gen 1989 anni
0.613
-0.005
-0.74%
1 gen 1990 anni
0.609
-0.005
-0.74%
1 gen 1991 anni
0.601
-0.007
-1.19%
1 gen 1992 anni
0.598
-0.004
-0.6%
1 gen 1993 anni
0.595
-0.003
-0.46%
1 gen 1994 anni
0.54
-0.055
-9.23%
1 gen 1995 anni
0.54
0.0
0.0%
1 gen 1996 anni
0.56
+0.02
3.7%
1 gen 1997 anni
0.573
+0.013
2.32%
1 gen 1998 anni
0.592
+0.019
3.32%
1 gen 1999 anni
0.558
-0.034
-5.74%
1 gen 2000 anni
0.676
+0.118
21.15%
1 gen 2001 anni
0.662
-0.014
-2.07%
1 gen 2002 anni
0.697
+0.035
5.29%
1 gen 2003 anni
0.645
-0.052
-7.46%
1 gen 2004 anni
0.679
+0.034
5.27%
1 gen 2005 anni
0.737
+0.058
8.54%
1 gen 2006 anni
0.768
+0.031
4.21%
1 gen 2007 anni
0.823
+0.055
7.16%
1 gen 2008 anni
1.039
+0.216
26.25%
1 gen 2009 anni
0.907
-0.132
-12.7%
1 gen 2010 anni
1.037
+0.13
14.33%
1 gen 2011 anni
1.118
+0.081
7.81%
1 gen 2012 anni
1.132
+0.014
1.25%
1 gen 2013 anni
1.142
+0.01
0.88%
1 gen 2014 anni
1.14
-0.002
-0.18%
1 gen 2015 anni
1.14
0.0
0.0%
Classificazione dei paesi secondo i statistiche attuali per anni


Commenti: