29
/it/
it
AIzaSyAYiBZKx7MnpbEhh9jyipgxe19OcubqV5w
April 1, 2024
129888
Estonia
EST
true
2
1
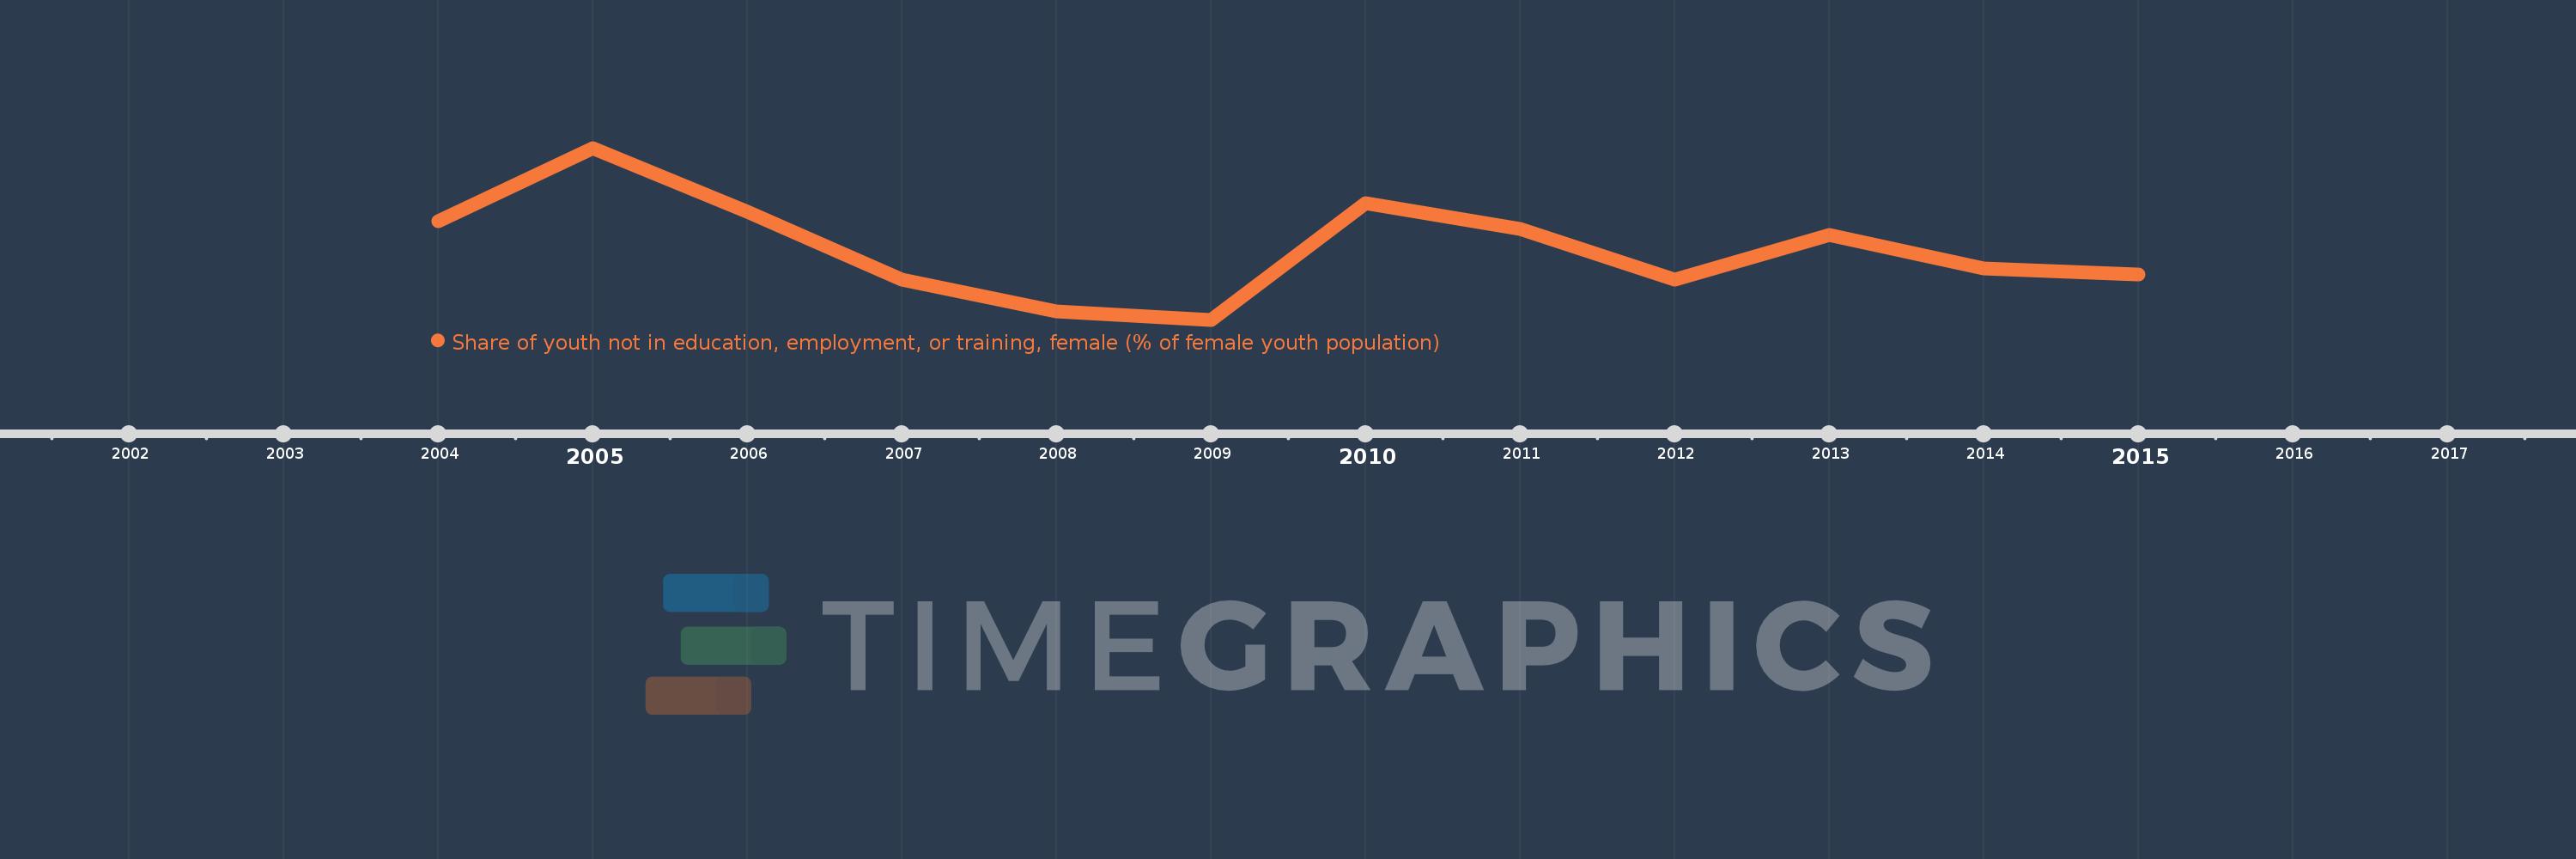
Share of youth not in education, employment, or training, female (% of female youth population)
2015,2014,2013,2012,2011,2010,2009,2008,2007,2006,2005,2004
Queste statistiche in altri paesi:
Linea del tempo:
Questa scala temporale mostra un grafico dal 2004 anno al 2015 anno. Estonia. I dati fino ad 2003 anno non disponibili. Il numero di osservazioni attuali secondo i date: 12.
La fonte (nome):
Indicatori dello sviluppo mondiale
La fonte (organizzazione):
International Labour Organization, Key Indicators of the Labour Market database.
Categorie:
Social Protection & Labor
sono stati aggiornati
23 apr 2017 anni
Indicatori delle variazioni dei valori per anni
Minima:
9.71
1 gen 2009 anni
Massimo:
16.77
1 gen 2005 anni
Alla data di osservazione
Valore
Variazione assoluta
La variazione rispetto al valore precedente
1 gen 2004 anni
13.76
+13.76
0.0%
1 gen 2005 anni
16.77
+3.01
21.88%
1 gen 2006 anni
14.14
-2.63
-15.68%
1 gen 2007 anni
11.36
-2.78
-19.66%
1 gen 2008 anni
10.06
-1.3
-11.44%
1 gen 2009 anni
9.71
-0.35
-3.48%
1 gen 2010 anni
14.5
+4.79
49.33%
1 gen 2011 anni
13.45
-1.05
-7.24%
1 gen 2012 anni
11.36
-2.09
-15.54%
1 gen 2013 anni
13.2
+1.84
16.2%
1 gen 2014 anni
11.82
-1.38
-10.45%
1 gen 2015 anni
11.57
-0.25
-2.12%
Classificazione dei paesi secondo i statistiche attuali per anni


Commenti: