30
/it/
AIzaSyAYiBZKx7MnpbEhh9jyipgxe19OcubqV5w
April 1, 2024
127599
Equatorial Guinea
GNQ
true
2
1
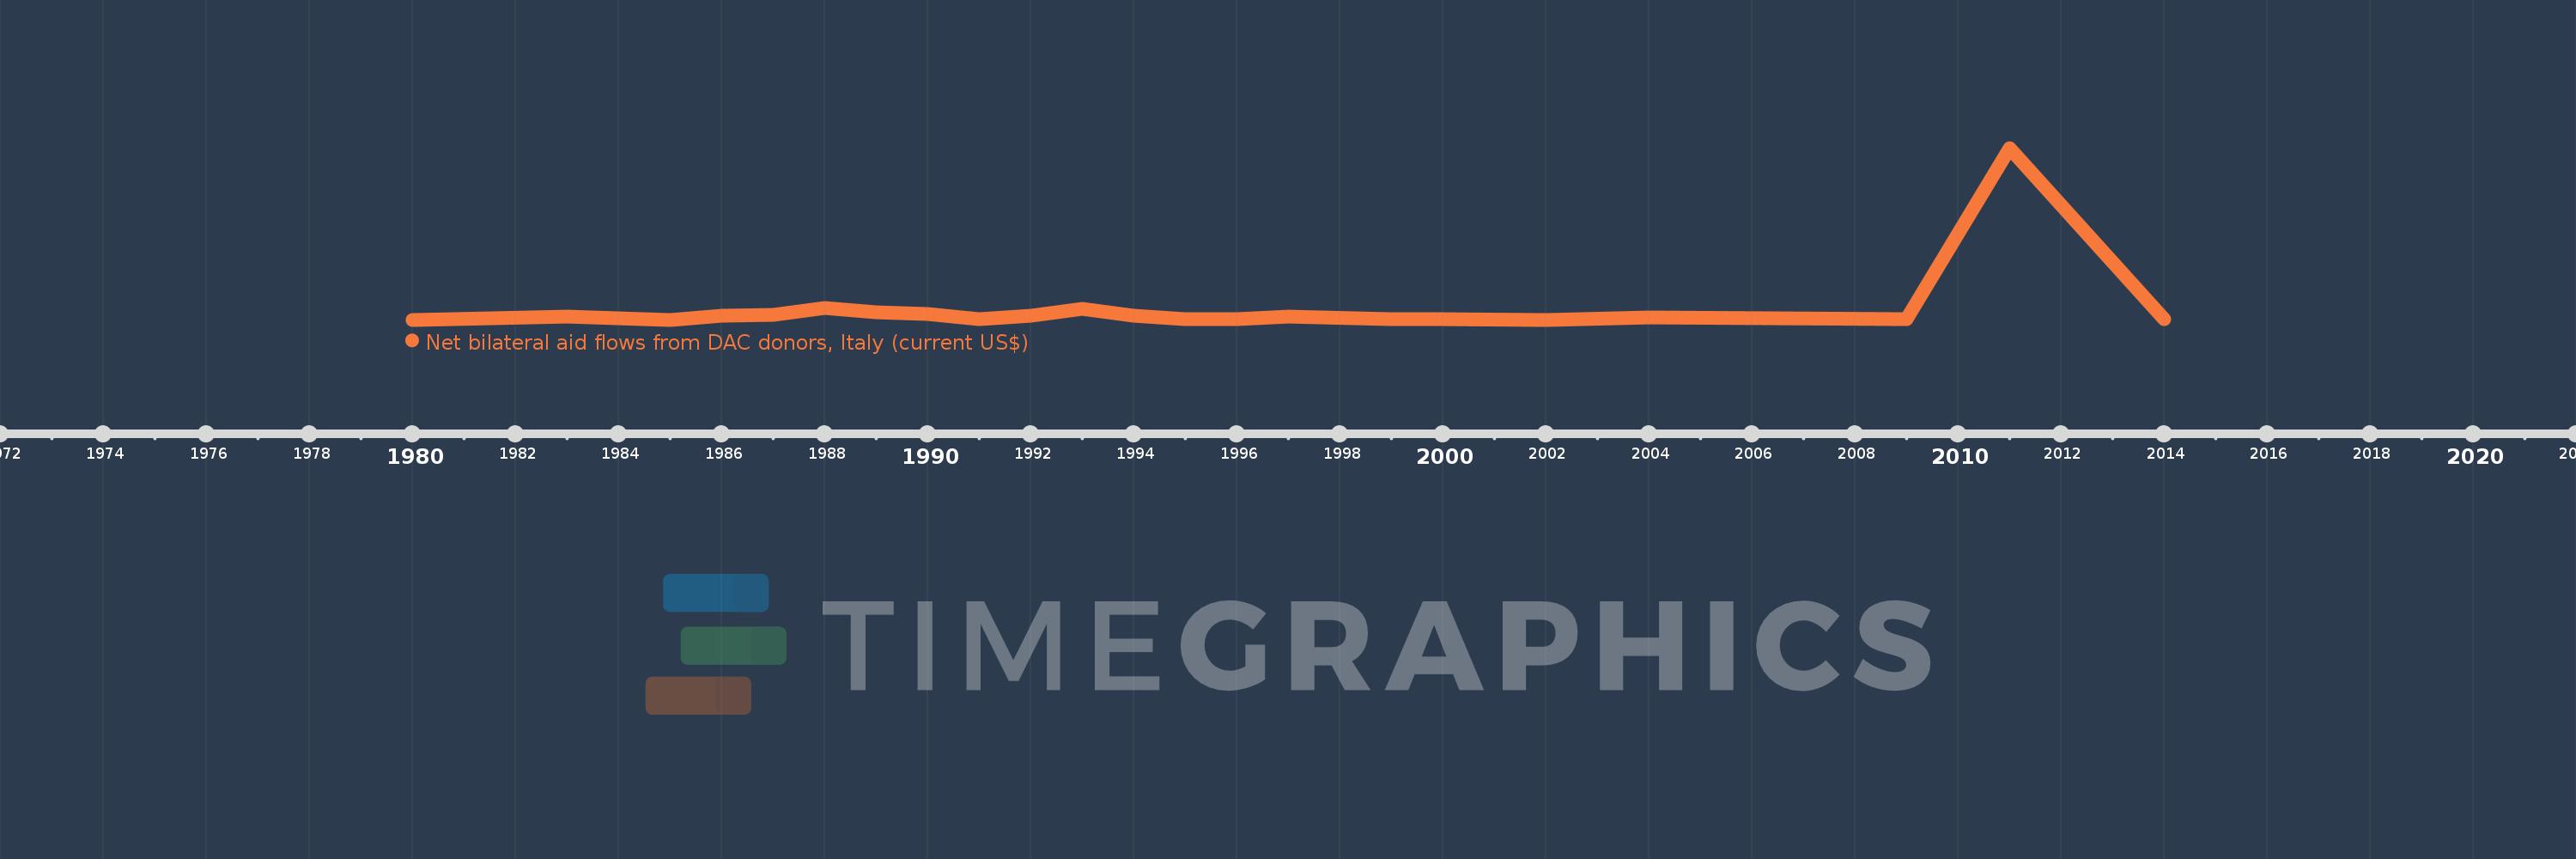
Net bilateral aid flows from DAC donors, Italy (current US$)
2014,2011,2009,2004,2002,2000,1999,1997,1996,1995,1994,1993,1992,1991,1990,1989,1988,1987,1986,1985,1983,1980
