29
/it/
it
AIzaSyAYiBZKx7MnpbEhh9jyipgxe19OcubqV5w
April 1, 2024
127384
Equatorial Guinea
GNQ
true
2
1
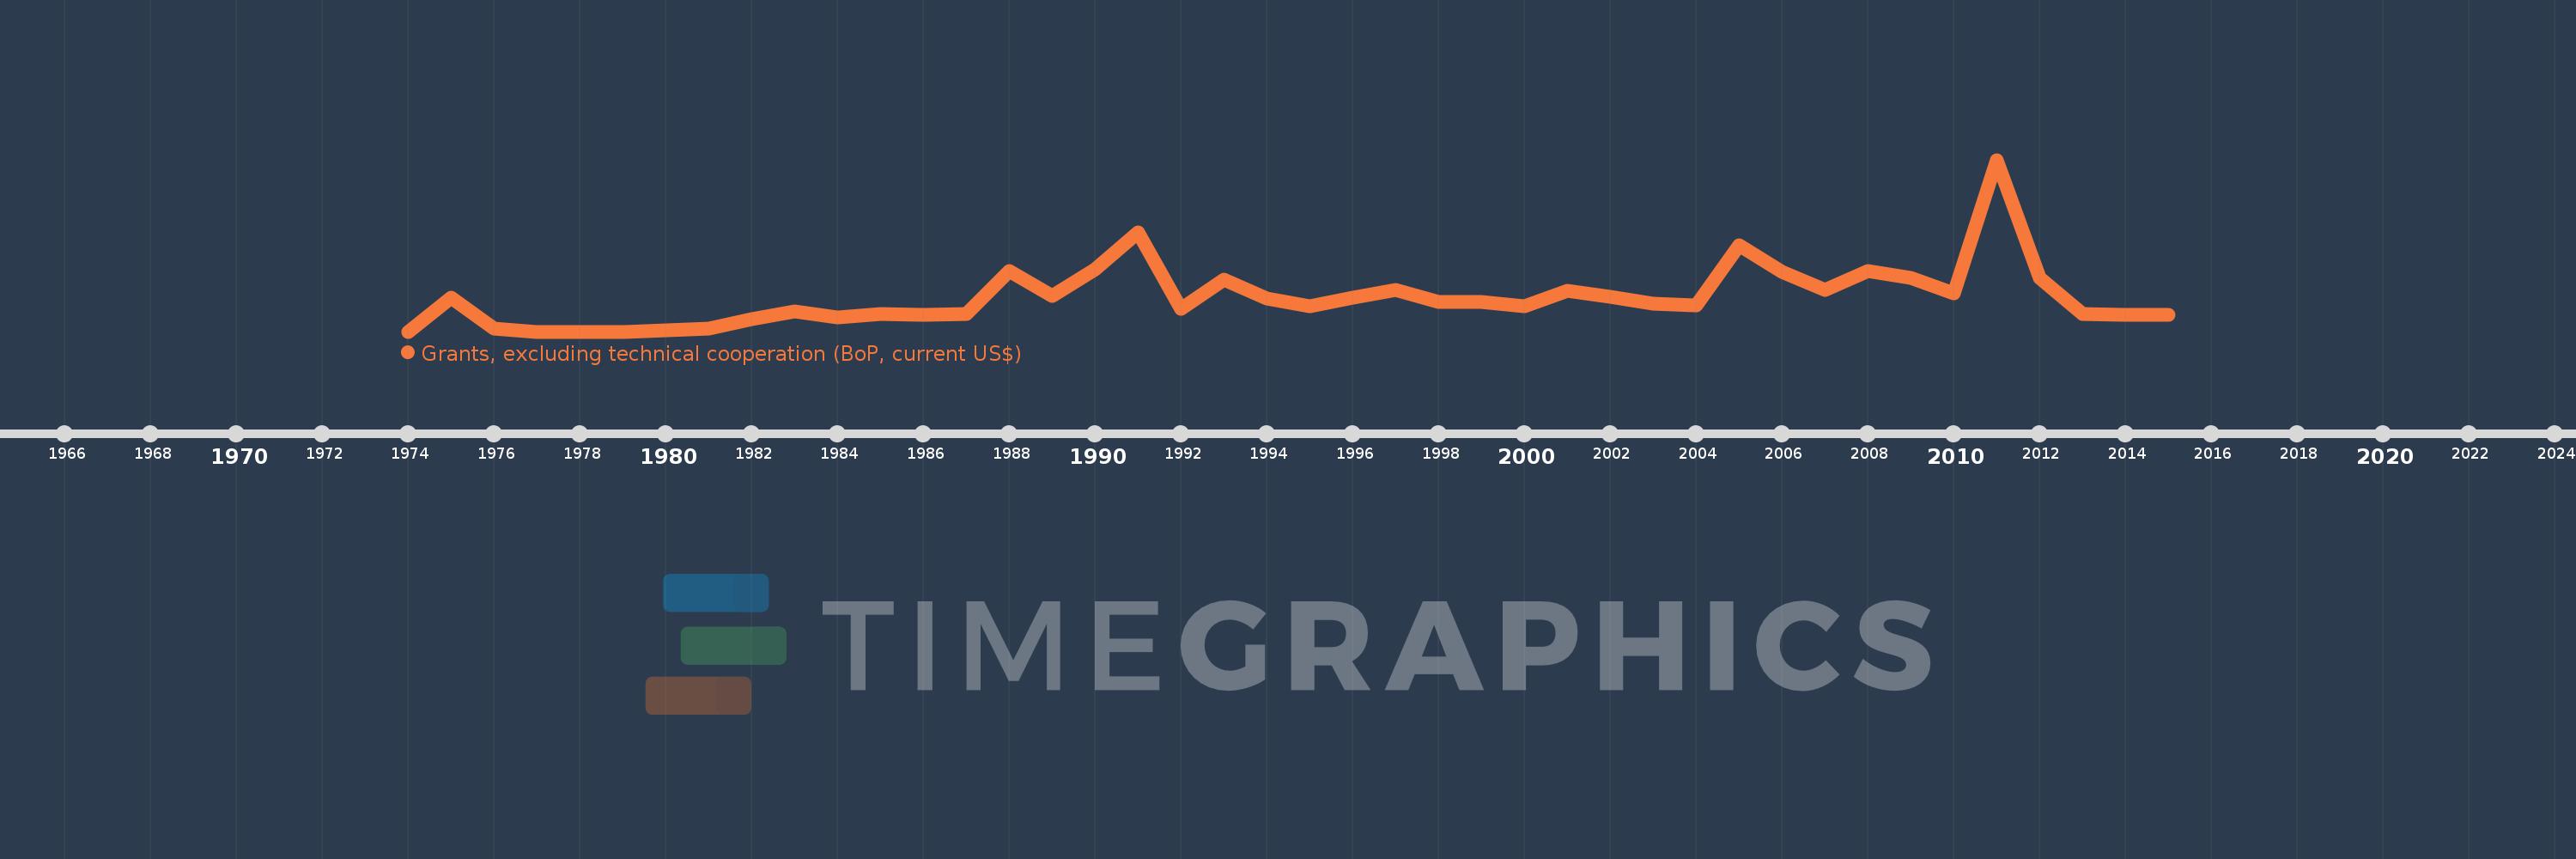
Grants, excluding technical cooperation (BoP, current US$)
2015,2014,2013,2012,2011,2010,2009,2008,2007,2006,2005,2004,2003,2002,2001,2000,1999,1998,1997,1996,1995,1994,1993,1992,1991,1990,1989,1988,1987,1986,1985,1984,1983,1982,1981,1980,1979,1978,1977,1976,1975,1974
Queste statistiche in altri paesi:
AfghanistanAlbaniaAlgeriaAngolaAntigua and BarbudaArgentinaArmeniaArubaAzerbaijanBahamas, TheBahrainBangladeshBarbadosBelarusBelizeBeninBermudaBhutanBoliviaBosnia and HerzegovinaBotswanaBrazilBrunei DarussalamBurkina FasoBurundiCabo VerdeCambodiaCameroonCayman IslandsCentral African RepublicChadChileChinaColombiaComorosCongo, Dem. Rep.Congo, Rep.Costa RicaCote d'IvoireCroatiaCubaCyprusDjiboutiDominicaDominican RepublicEcuadorEgypt, Arab Rep.El SalvadorEquatorial GuineaEritreaEthiopiaFijiFrench PolynesiaGabonGambia, TheGeorgiaGhanaGibraltarGrenadaGuatemalaGuineaGuinea-BissauGuyanaHaitiHondurasHong Kong SAR, ChinaIndiaIndonesiaIran, Islamic Rep.IraqIsraelJamaicaJordanKazakhstanKenyaKiribatiKorea, Dem. People’s Rep.Korea, Rep.KosovoKuwaitKyrgyz RepublicLao PDRLebanonLesothoLiberiaLibyaLow & middle incomeMacedonia, FYRMadagascarMalawiMalaysiaMaldivesMaliMaltaMarshall IslandsMauritaniaMauritiusMexicoMicronesia, Fed. Sts.MoldovaMongoliaMontenegroMoroccoMozambiqueMyanmarNamibiaNepalNew CaledoniaNicaraguaNigerNigeriaOmanPakistanPalauPanamaPapua New GuineaParaguayPeruPhilippinesQatarRwandaSamoaSao Tome and PrincipeSaudi ArabiaSenegalSerbiaSeychellesSierra LeoneSingaporeSloveniaSolomon IslandsSomaliaSouth AfricaSouth SudanSri LankaSt. Kitts and NevisSt. LuciaSt. Vincent and the GrenadinesSudanSurinameSwazilandSyrian Arab RepublicTajikistanTanzaniaThailandTimor-LesteTogoTongaTrinidad and TobagoTunisiaTurkeyTurkmenistanTurks and Caicos IslandsTuvaluUgandaUkraineUnited Arab EmiratesUruguayUzbekistanVanuatuVenezuela, RBVietnamWest Bank and GazaYemen, Rep.ZambiaZimbabwe Linea del tempo:
Questa scala temporale mostra un grafico dal 1974 anno al 2015 anno. Equatorial Guinea. I dati fino ad 1973 anno non disponibili. Il numero di osservazioni attuali secondo i date: 42.
La fonte (nome):
Indicatori dello sviluppo mondiale
La fonte (organizzazione):
World Bank, International Debt Statistics, and OECD.
Categorie:
Economy & Growth, External Debt, Aid Effectiveness
sono stati aggiornati
23 apr 2017 anni
Indicatori delle variazioni dei valori per anni
Minima:
0.0
1 gen 1974 anni
Massimo:
75.53 Mln
1 gen 2011 anni
Alla data di osservazione
Valore
Variazione assoluta
La variazione rispetto al valore precedente
1 gen 1974 anni
0.0
0.0
0.0%
1 gen 1975 anni
15.0 Mln
+15.0 Mln
%
1 gen 1976 anni
1.2 Mln
-13.8 Mln
-92.0%
1 gen 1977 anni
0.0
-1.2 Mln
-100.0%
1 gen 1980 anni
430.0 Mille.
+430.0 Mille.
%
1 gen 1981 anni
1.39 Mln
+960.0 Mille.
223.26%
1 gen 1982 anni
5.29 Mln
+3.9 Mln
280.58%
1 gen 1983 anni
8.8 Mln
+3.51 Mln
66.35%
1 gen 1984 anni
6.1 Mln
-2.7 Mln
-30.68%
1 gen 1985 anni
7.77 Mln
+1.67 Mln
27.38%
1 gen 1986 anni
7.19 Mln
-580.0 Mille.
-7.46%
1 gen 1987 anni
7.81 Mln
+620.0 Mille.
8.62%
1 gen 1988 anni
26.48 Mln
+18.67 Mln
239.05%
1 gen 1989 anni
15.66 Mln
-10.82 Mln
-40.86%
1 gen 1990 anni
27.48 Mln
+11.82 Mln
75.48%
1 gen 1991 anni
43.45 Mln
+15.97 Mln
58.11%
1 gen 1992 anni
10.04 Mln
-33.41 Mln
-76.89%
1 gen 1993 anni
22.91 Mln
+12.87 Mln
128.19%
1 gen 1994 anni
14.61 Mln
-8.3 Mln
-36.23%
1 gen 1995 anni
10.96 Mln
-3.65 Mln
-24.98%
1 gen 1996 anni
15.0 Mln
+4.04 Mln
36.86%
1 gen 1997 anni
18.35 Mln
+3.35 Mln
22.33%
1 gen 1998 anni
13.09 Mln
-5.26 Mln
-28.66%
1 gen 1999 anni
12.94 Mln
-150.0 Mille.
-1.15%
1 gen 2000 anni
11.29 Mln
-1.65 Mln
-12.75%
1 gen 2001 anni
17.86 Mln
+6.57 Mln
58.19%
1 gen 2002 anni
15.4 Mln
-2.46 Mln
-13.77%
1 gen 2003 anni
12.46 Mln
-2.94 Mln
-19.09%
1 gen 2004 anni
11.59 Mln
-870.0 Mille.
-6.98%
1 gen 2005 anni
37.9 Mln
+26.31 Mln
227.01%
1 gen 2006 anni
26.06 Mln
-11.84 Mln
-31.24%
1 gen 2007 anni
18.31 Mln
-7.75 Mln
-29.74%
1 gen 2008 anni
26.57 Mln
+8.26 Mln
45.11%
1 gen 2009 anni
23.45 Mln
-3.12 Mln
-11.74%
1 gen 2010 anni
16.95 Mln
-6.5 Mln
-27.72%
1 gen 2011 anni
75.53 Mln
+58.58 Mln
345.6%
1 gen 2012 anni
23.77 Mln
-51.76 Mln
-68.53%
1 gen 2013 anni
7.62 Mln
-16.15 Mln
-67.94%
1 gen 2014 anni
7.27 Mln
-350.0 Mille.
-4.59%
1 gen 2015 anni
7.37 Mln
+100.0 Mille.
1.38%
Classificazione dei paesi secondo i statistiche attuali per anni


Commenti: