29
/it/
it
AIzaSyAYiBZKx7MnpbEhh9jyipgxe19OcubqV5w
April 1, 2024
124335
Ecuador
ECU
true
2
1
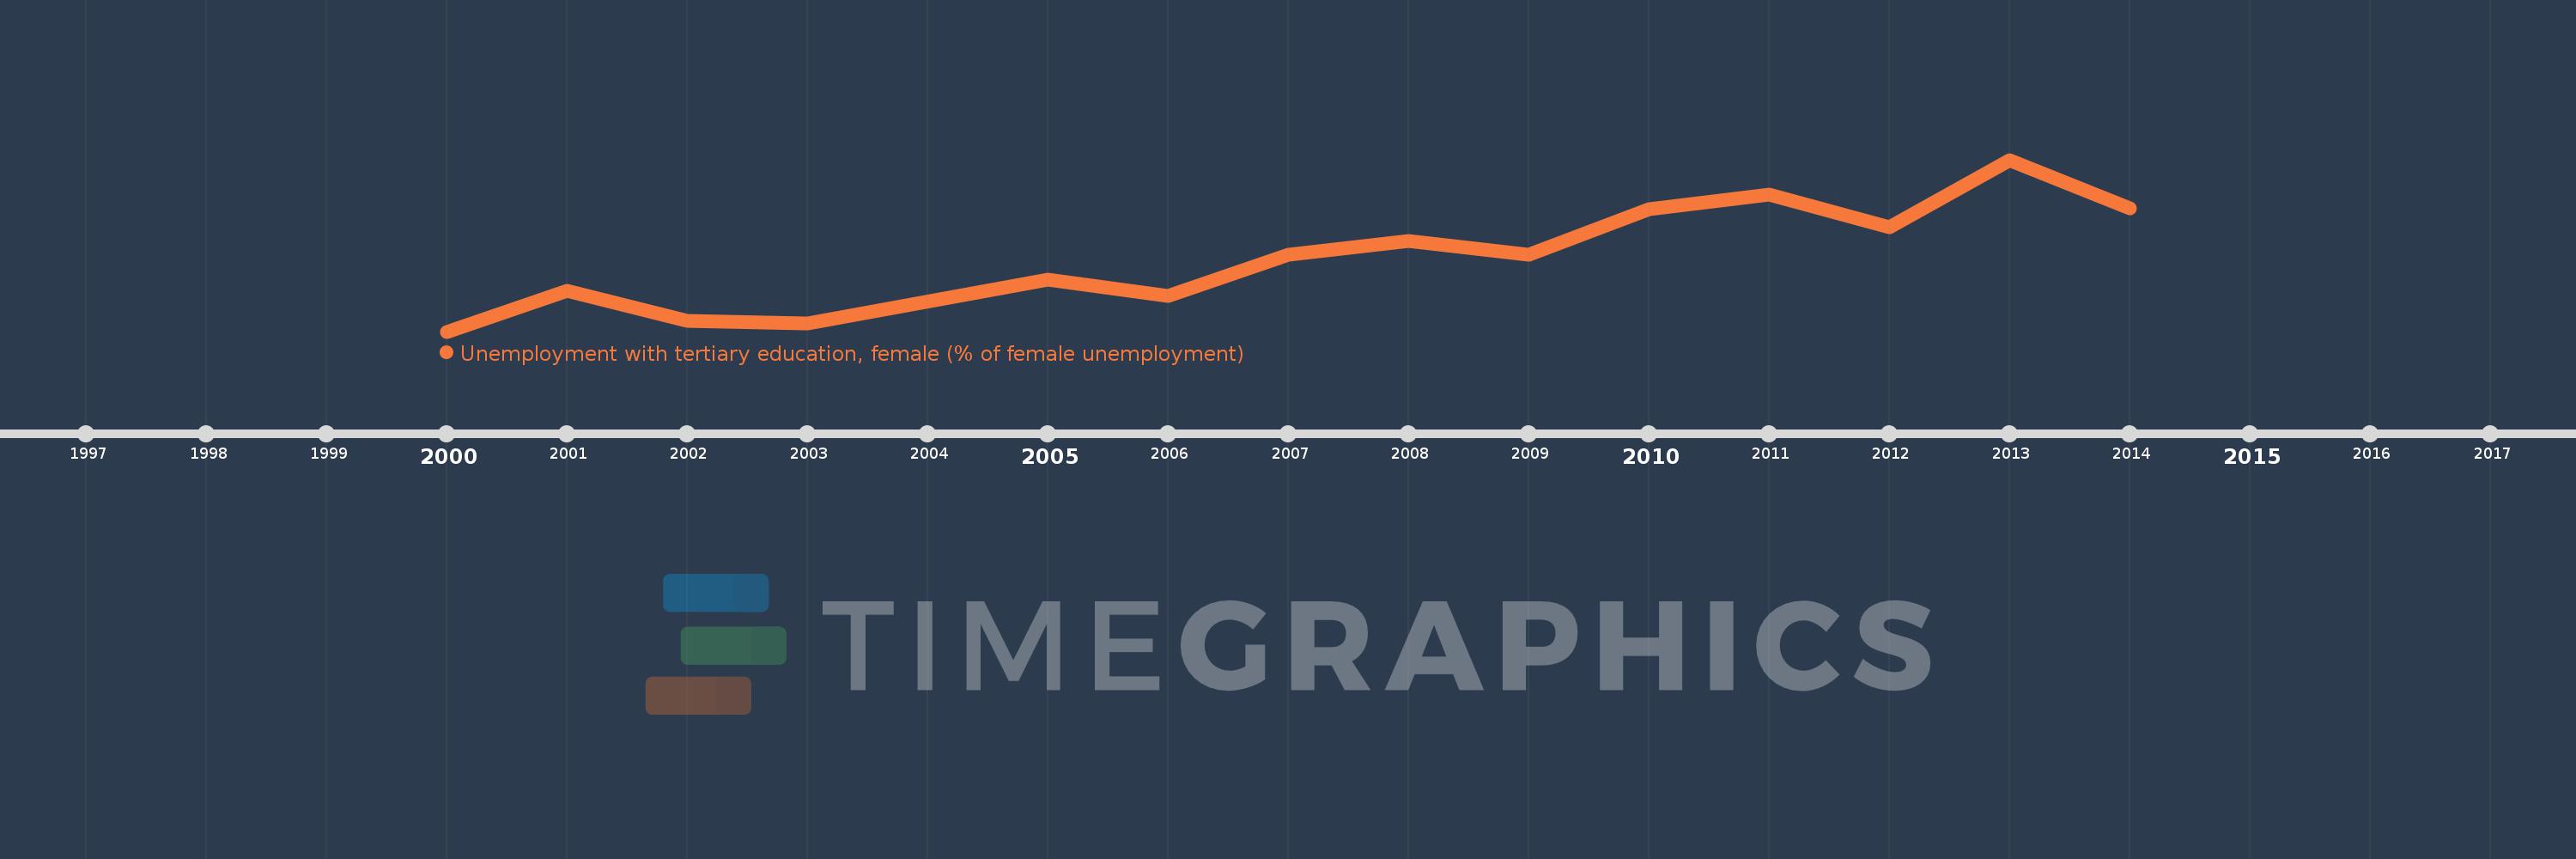
Unemployment with tertiary education, female (% of female unemployment)
2014,2013,2012,2011,2010,2009,2008,2007,2006,2005,2003,2002,2001,2000
Queste statistiche in altri paesi:
Linea del tempo:
Questa scala temporale mostra un grafico dal 2000 anno al 2014 anno. Ecuador. I dati fino ad 1999 anno non disponibili. Il numero di osservazioni attuali secondo i date: 14.
La fonte (nome):
Indicatori dello sviluppo mondiale
La fonte (organizzazione):
International Labour Organization, Key Indicators of the Labour Market database.
Categorie:
Social Protection & Labor, Gender
sono stati aggiornati
23 apr 2017 anni
Indicatori delle variazioni dei valori per anni
Minima:
19.8
1 gen 2000 anni
Massimo:
32.3
1 gen 2013 anni
Alla data di osservazione
Valore
Variazione assoluta
La variazione rispetto al valore precedente
1 gen 2000 anni
19.8
+19.8
0.0%
1 gen 2001 anni
22.8
+3.0
15.15%
1 gen 2002 anni
20.6
-2.2
-9.65%
1 gen 2003 anni
20.4
-0.2
-0.97%
1 gen 2005 anni
23.6
+3.2
15.69%
1 gen 2006 anni
22.4
-1.2
-5.08%
1 gen 2007 anni
25.4
+3.0
13.39%
1 gen 2008 anni
26.4
+1.0
3.94%
1 gen 2009 anni
25.4
-1.0
-3.79%
1 gen 2010 anni
28.7
+3.3
12.99%
1 gen 2011 anni
29.8
+1.1
3.83%
1 gen 2012 anni
27.4
-2.4
-8.05%
1 gen 2013 anni
32.3
+4.9
17.88%
1 gen 2014 anni
28.8
-3.5
-10.84%
Classificazione dei paesi secondo i statistiche attuali per anni


Commenti: