29
/it/
it
AIzaSyAYiBZKx7MnpbEhh9jyipgxe19OcubqV5w
April 1, 2024
115635
Cuba
CUB
true
2
1
CO2 emissions (metric tons per capita)
2014,2013,2012,2011,2010,2009,2008,2007,2006,2005,2004,2003,2002,2001,2000,1999,1998,1997,1996,1995,1994,1993,1992,1991,1990,1989,1988,1987,1986,1985,1984,1983,1982,1981,1980,1979,1978,1977,1976,1975,1974,1973,1972,1971,1970,1969,1968,1967,1966,1965,1964,1963,1962,1961
Queste statistiche in altri paesi:
AfghanistanAlbaniaAlgeriaAndorraAngolaAntigua and BarbudaArab WorldArgentinaArmeniaArubaAustraliaAustriaAzerbaijanBahamas, TheBahrainBangladeshBarbadosBelarusBelgiumBelizeBeninBermudaBhutanBoliviaBosnia and HerzegovinaBotswanaBrazilBritish Virgin IslandsBrunei DarussalamBulgariaBurkina FasoBurundiCabo VerdeCambodiaCameroonCanadaCaribbean small statesCayman IslandsCentral African RepublicCentral Europe and the BalticsChadChileChinaColombiaComorosCongo, Dem. Rep.Congo, Rep.Costa RicaCote d'IvoireCroatiaCubaCuracaoCyprusCzech RepublicDenmarkDjiboutiDominicaDominican RepublicEarly-demographic dividendEast Asia & PacificEast Asia & Pacific (excluding high income)East Asia & Pacific (IDA & IBRD countries)EcuadorEgypt, Arab Rep.El SalvadorEquatorial GuineaEritreaEstoniaEthiopiaEuro areaEurope & Central AsiaEurope & Central Asia (excluding high income)Europe & Central Asia (IDA & IBRD countries)European UnionFaroe IslandsFijiFinlandFragile and conflict affected situationsFranceFrench PolynesiaGabonGambia, TheGeorgiaGermanyGhanaGibraltarGreeceGreenlandGrenadaGuatemalaGuineaGuinea-BissauGuyanaHaitiHeavily indebted poor countries (HIPC)High incomeHondurasHong Kong SAR, ChinaHungaryIBRD onlyIcelandIDA & IBRD totalIDA blendIDA onlyIDA totalIndiaIndonesiaIran, Islamic Rep.IraqIrelandIsraelItalyJamaicaJapanJordanKazakhstanKenyaKiribatiKorea, Dem. People’s Rep.Korea, Rep.KuwaitKyrgyz RepublicLao PDRLate-demographic dividendLatin America & Caribbean Latin America & Caribbean (excluding high income)Latin America & the Caribbean (IDA & IBRD countries)LatviaLeast developed countries: UN classificationLebanonLesothoLiberiaLibyaLiechtensteinLithuaniaLow & middle incomeLow incomeLower middle incomeLuxembourgMacao SAR, ChinaMacedonia, FYRMadagascarMalawiMalaysiaMaldivesMaliMaltaMarshall IslandsMauritaniaMauritiusMexicoMicronesia, Fed. Sts.Middle East & North AfricaMiddle East & North Africa (excluding high income)Middle East & North Africa (IDA & IBRD countries)Middle incomeMoldovaMongoliaMontenegroMoroccoMozambiqueMyanmarNamibiaNauruNepalNetherlandsNew CaledoniaNew ZealandNicaraguaNigerNigeriaNorth AmericaNorwayOECD membersOmanOther small statesPacific island small statesPakistanPalauPanamaPapua New GuineaParaguayPeruPhilippinesPolandPortugalPost-demographic dividendPre-demographic dividendQatarRomaniaRussian FederationRwandaSamoaSao Tome and PrincipeSaudi ArabiaSenegalSerbiaSeychellesSierra LeoneSingaporeSint Maarten (Dutch part)Slovak RepublicSloveniaSmall statesSolomon IslandsSomaliaSouth AfricaSouth AsiaSouth Asia (IDA & IBRD)South SudanSpainSri LankaSt. Kitts and NevisSt. LuciaSt. Vincent and the GrenadinesSub-Saharan Africa Sub-Saharan Africa (excluding high income)Sub-Saharan Africa (IDA & IBRD countries)SudanSurinameSwazilandSwedenSwitzerlandSyrian Arab RepublicTajikistanTanzaniaThailandTimor-LesteTogoTongaTrinidad and TobagoTunisiaTurkeyTurkmenistanTurks and Caicos IslandsUgandaUkraineUnited Arab EmiratesUnited KingdomUnited StatesUpper middle incomeUruguayUzbekistanVanuatuVenezuela, RBVietnamWest Bank and GazaWorldYemen, Rep.ZambiaZimbabwe Linea del tempo:
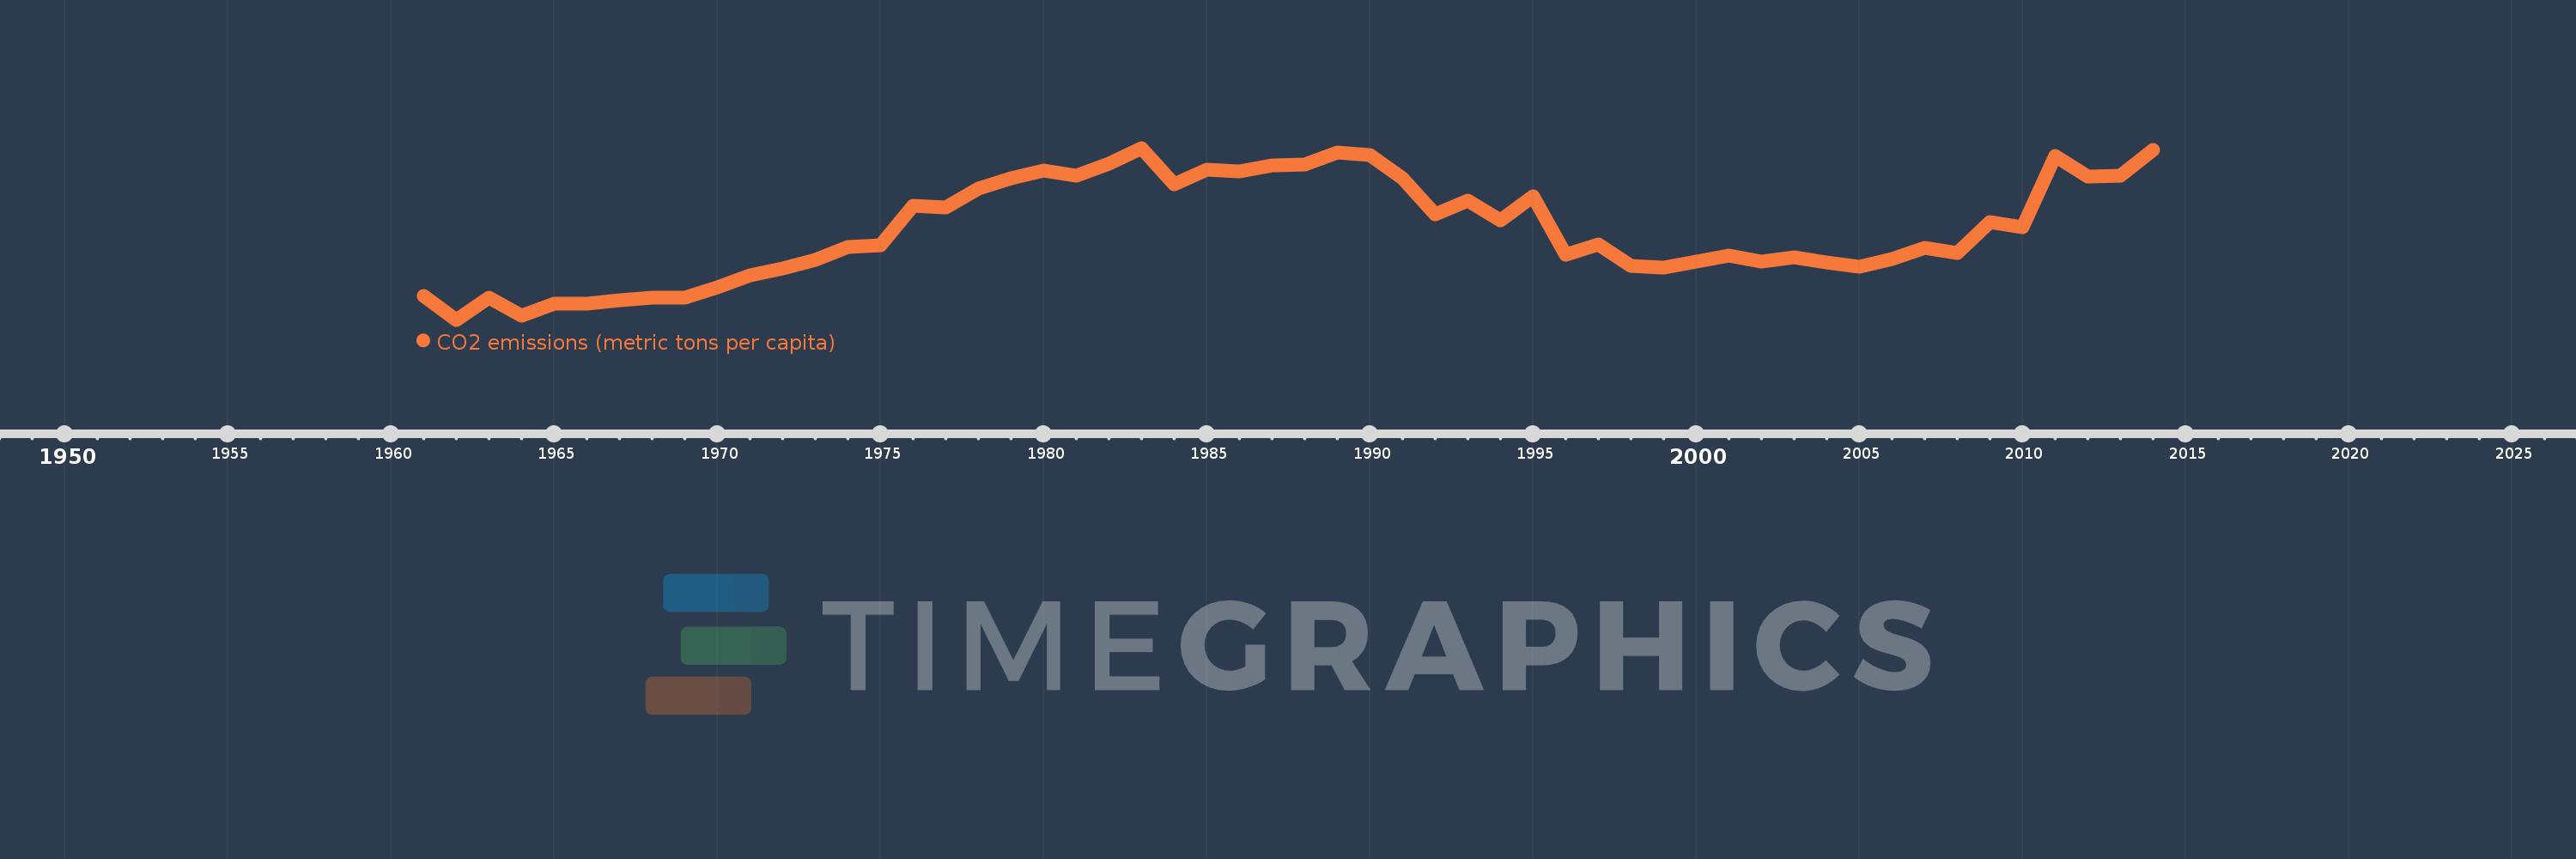
Questa scala temporale mostra un grafico dal 1961 anno al 2014 anno. Cuba. I dati fino ad 1960 anno non disponibili. Il numero di osservazioni attuali secondo i date: 54.
La fonte (nome):
Indicatori dello sviluppo mondiale
La fonte (organizzazione):
Carbon Dioxide Information Analysis Center, Environmental Sciences Division, Oak Ridge National Laboratory, Tennessee, United States.
Categorie:
Climate Change, Environment
sono stati aggiornati
23 apr 2017 anni
Indicatori delle variazioni dei valori per anni
Minima:
1.671
1 gen 1962 anni
Massimo:
3.481
1 gen 1983 anni
Alla data di osservazione
Valore
Variazione assoluta
La variazione rispetto al valore precedente
1 gen 1961 anni
1.918
+1.918
0.0%
1 gen 1962 anni
1.671
-0.247
-12.9%
1 gen 1963 anni
1.902
+0.231
13.81%
1 gen 1964 anni
1.712
-0.19
-10.0%
1 gen 1965 anni
1.836
+0.124
7.24%
1 gen 1966 anni
1.837
+0.002
0.09%
1 gen 1967 anni
1.872
+0.035
1.91%
1 gen 1968 anni
1.906
+0.034
1.8%
1 gen 1969 anni
1.906
+0.0
0.0%
1 gen 1970 anni
2.016
+0.11
5.75%
1 gen 1971 anni
2.143
+0.127
6.29%
1 gen 1972 anni
2.211
+0.068
3.17%
1 gen 1973 anni
2.305
+0.094
4.25%
1 gen 1974 anni
2.441
+0.136
5.92%
1 gen 1975 anni
2.46
+0.019
0.76%
1 gen 1976 anni
2.868
+0.408
16.59%
1 gen 1977 anni
2.852
-0.015
-0.53%
1 gen 1978 anni
3.052
+0.199
6.99%
1 gen 1979 anni
3.16
+0.108
3.55%
1 gen 1980 anni
3.243
+0.083
2.64%
1 gen 1981 anni
3.193
-0.051
-1.57%
1 gen 1982 anni
3.313
+0.121
3.78%
1 gen 1983 anni
3.481
+0.168
5.07%
1 gen 1984 anni
3.095
-0.387
-11.11%
1 gen 1985 anni
3.255
+0.16
5.18%
1 gen 1986 anni
3.231
-0.024
-0.73%
1 gen 1987 anni
3.301
+0.07
2.18%
1 gen 1988 anni
3.306
+0.005
0.15%
1 gen 1989 anni
3.433
+0.127
3.85%
1 gen 1990 anni
3.408
-0.025
-0.74%
1 gen 1991 anni
3.165
-0.243
-7.13%
1 gen 1992 anni
2.781
-0.384
-12.15%
1 gen 1993 anni
2.923
+0.143
5.13%
1 gen 1994 anni
2.721
-0.202
-6.93%
1 gen 1995 anni
2.971
+0.25
9.2%
1 gen 1996 anni
2.357
-0.614
-20.66%
1 gen 1997 anni
2.464
+0.107
4.53%
1 gen 1998 anni
2.241
-0.223
-9.07%
1 gen 1999 anni
2.219
-0.022
-0.98%
1 gen 2000 anni
2.286
+0.067
3.04%
1 gen 2001 anni
2.346
+0.06
2.63%
1 gen 2002 anni
2.282
-0.064
-2.72%
1 gen 2003 anni
2.333
+0.05
2.2%
1 gen 2004 anni
2.272
-0.06
-2.58%
1 gen 2005 anni
2.225
-0.048
-2.11%
1 gen 2006 anni
2.309
+0.085
3.82%
1 gen 2007 anni
2.431
+0.121
5.25%
1 gen 2008 anni
2.375
-0.056
-2.31%
1 gen 2009 anni
2.696
+0.322
13.55%
1 gen 2010 anni
2.646
-0.05
-1.86%
1 gen 2011 anni
3.394
+0.747
28.24%
1 gen 2012 anni
3.178
-0.215
-6.35%
1 gen 2013 anni
3.188
+0.01
0.3%
1 gen 2014 anni
3.462
+0.275
8.61%
Classificazione dei paesi secondo i statistiche attuali per anni


Commenti: