29
/it/
it
AIzaSyAYiBZKx7MnpbEhh9jyipgxe19OcubqV5w
April 1, 2024
115583
Cuba
CUB
true
2
1
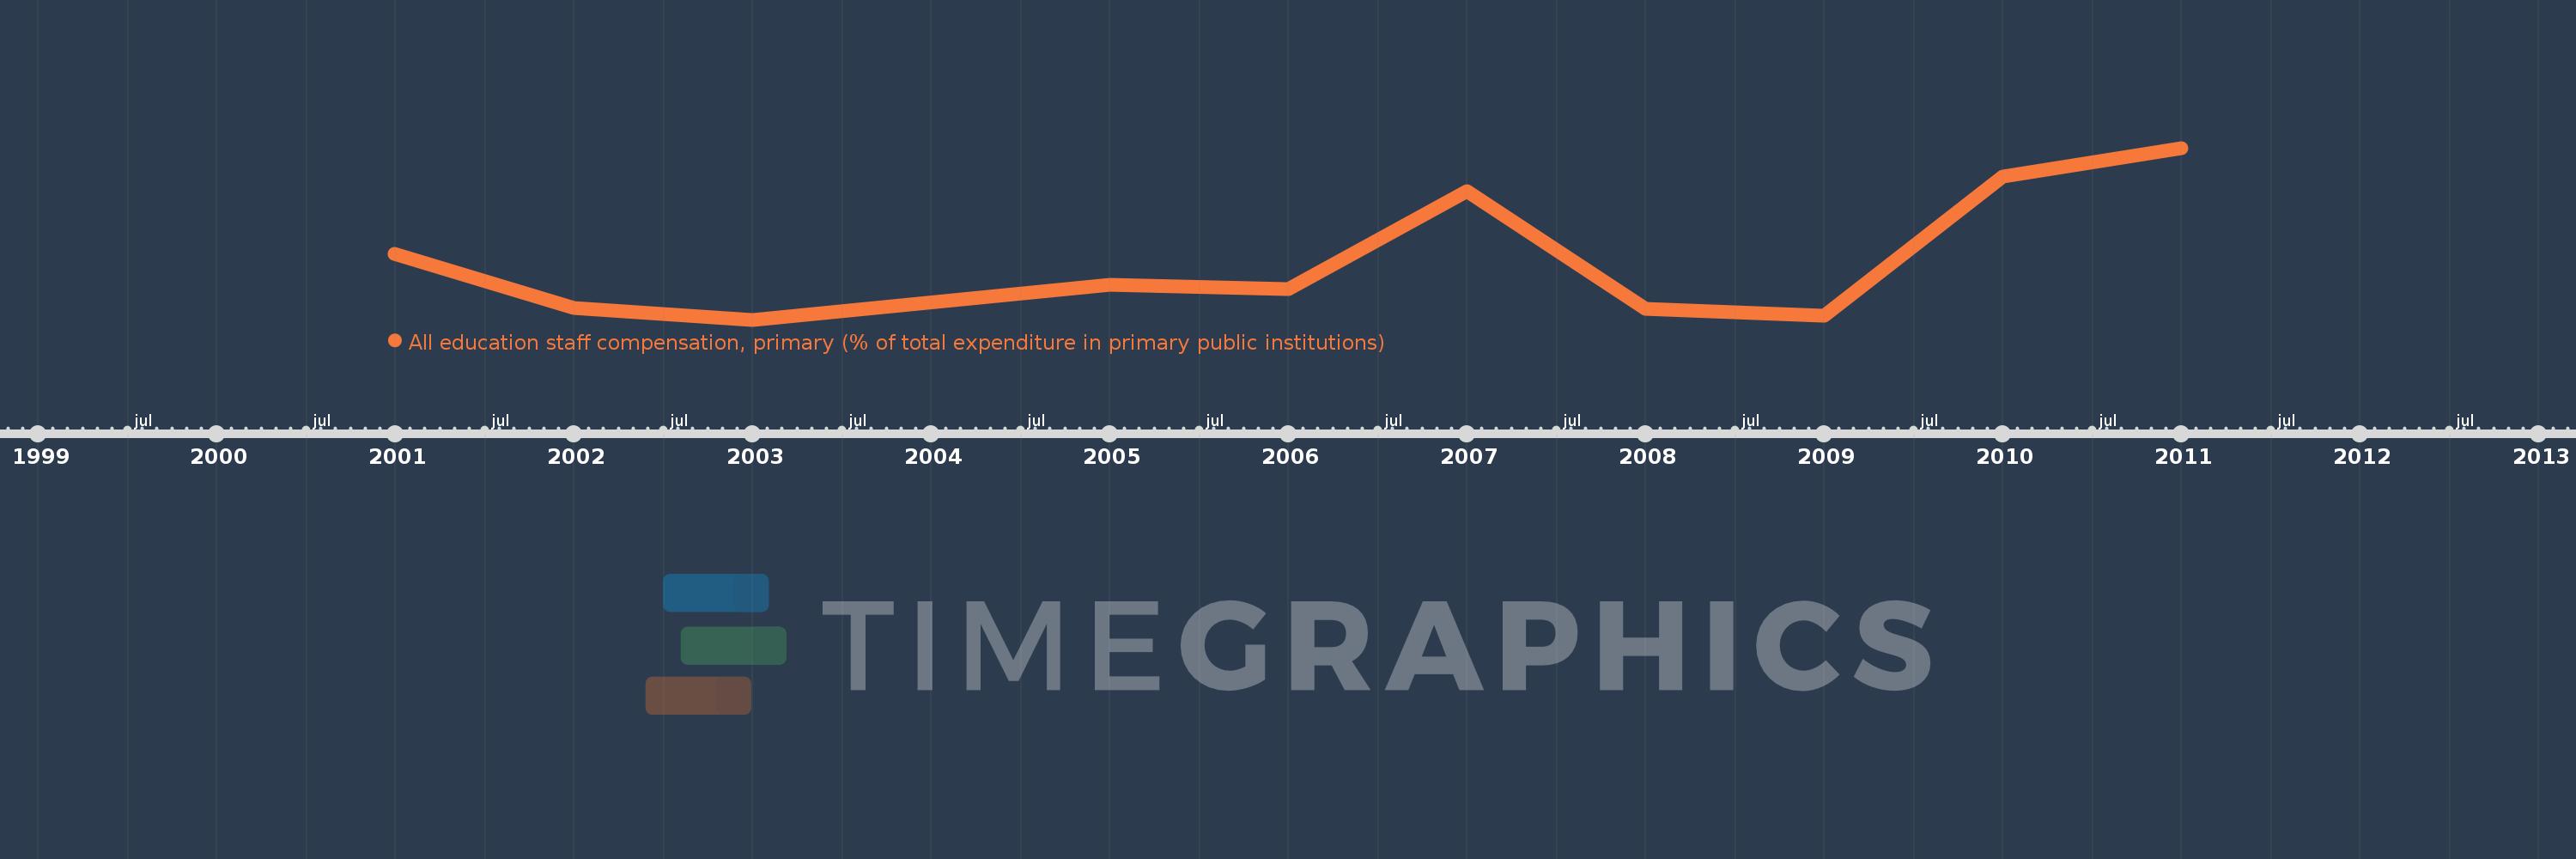
All education staff compensation, primary (% of total expenditure in primary public institutions)
2011,2010,2009,2008,2007,2006,2005,2003,2002,2001
Queste statistiche in altri paesi:
Linea del tempo:
Questa scala temporale mostra un grafico dal 2001 anno al 2011 anno. Cuba. I dati fino ad 2000 anno non disponibili. Il numero di osservazioni attuali secondo i date: 10.
La fonte (nome):
Indicatori dello sviluppo mondiale
La fonte (organizzazione):
United Nations Educational, Scientific, and Cultural Organization (UNESCO) Institute for Statistics.
Categorie:
Education
sono stati aggiornati
23 apr 2017 anni
Indicatori delle variazioni dei valori per anni
Minima:
59.988
1 gen 2003 anni
Massimo:
79.789
1 gen 2011 anni
Alla data di osservazione
Valore
Variazione assoluta
La variazione rispetto al valore precedente
1 gen 2001 anni
67.612
+67.612
0.0%
1 gen 2002 anni
61.39
-6.222
-9.2%
1 gen 2003 anni
59.988
-1.402
-2.28%
1 gen 2005 anni
64.064
+4.076
6.79%
1 gen 2006 anni
63.499
-0.565
-0.88%
1 gen 2007 anni
74.823
+11.324
17.83%
1 gen 2008 anni
61.278
-13.544
-18.1%
1 gen 2009 anni
60.45
-0.829
-1.35%
1 gen 2010 anni
76.531
+16.081
26.6%
1 gen 2011 anni
79.789
+3.258
4.26%
Classificazione dei paesi secondo i statistiche attuali per anni


Commenti: