29
/it/
it
AIzaSyAYiBZKx7MnpbEhh9jyipgxe19OcubqV5w
April 1, 2024
114244
Cote d'Ivoire
CIV
true
2
1
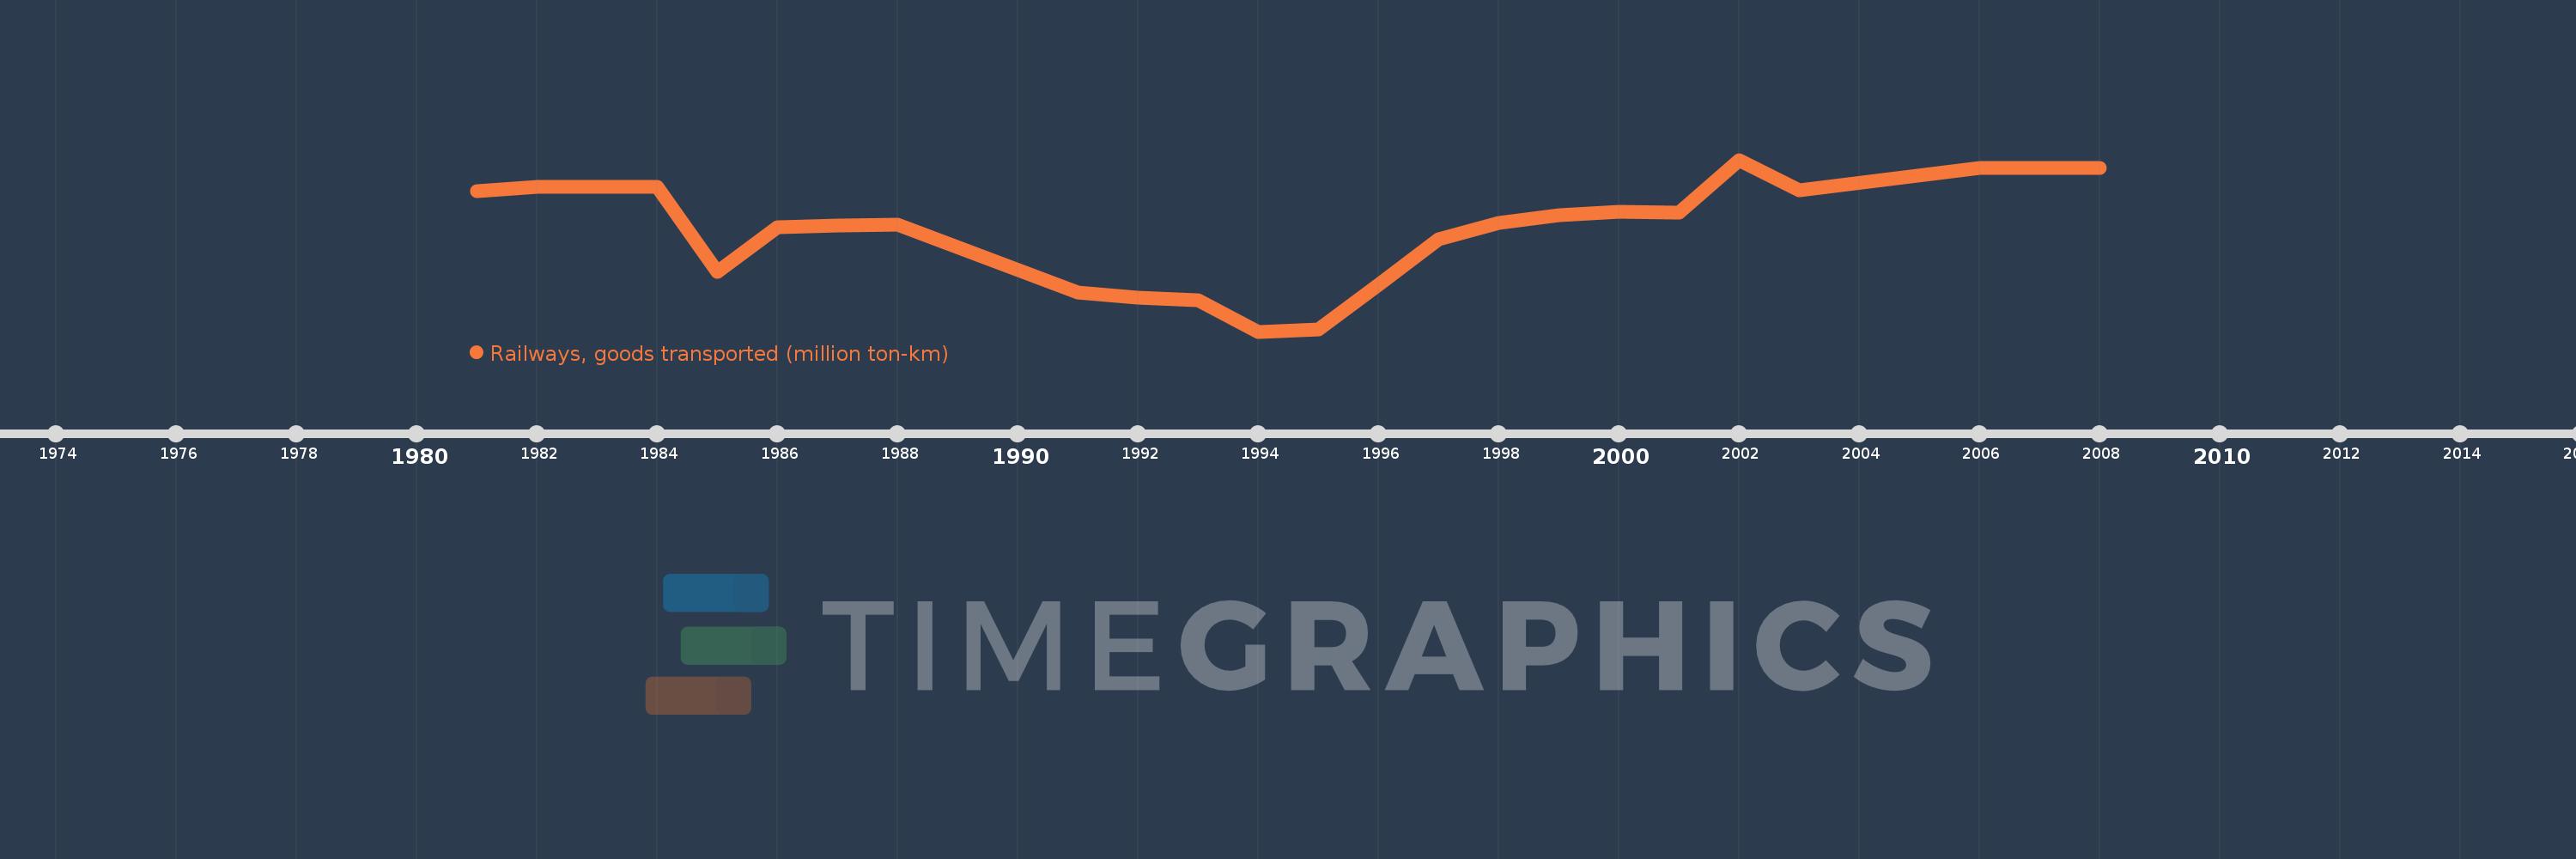
Railways, goods transported (million ton-km)
2008,2007,2006,2003,2002,2001,2000,1999,1998,1997,1996,1995,1994,1993,1992,1991,1988,1987,1986,1985,1984,1983,1982,1981
Queste statistiche in altri paesi:
Linea del tempo:
Questa scala temporale mostra un grafico dal 1981 anno al 2008 anno. Cote d'Ivoire. I dati fino ad 1980 anno non disponibili. Il numero di osservazioni attuali secondo i date: 24.
La fonte (nome):
Indicatori dello sviluppo mondiale
La fonte (organizzazione):
World Bank, Transportation, Water, and Information and Communications Technologies Department, Transport Division.
Categorie:
Infrastructure
sono stati aggiornati
23 apr 2017 anni
Indicatori delle variazioni dei valori per anni
Minima:
168.0
1 gen 1994 anni
Massimo:
699.0
1 gen 2002 anni
Alla data di osservazione
Valore
Variazione assoluta
La variazione rispetto al valore precedente
1 gen 1981 anni
602.2
+602.2
0.0%
1 gen 1982 anni
616.0
+13.8
2.29%
1 gen 1983 anni
616.0
0.0
0.0%
1 gen 1984 anni
615.9
-0.1
-0.02%
1 gen 1985 anni
353.0
-262.9
-42.69%
1 gen 1986 anni
491.0
+138.0
39.09%
1 gen 1987 anni
495.0
+4.0
0.81%
1 gen 1988 anni
499.0
+4.0
0.81%
1 gen 1991 anni
289.0
-210.0
-42.08%
1 gen 1992 anni
274.0
-15.0
-5.19%
1 gen 1993 anni
266.0
-8.0
-2.92%
1 gen 1994 anni
168.0
-98.0
-36.84%
1 gen 1995 anni
175.0
+7.0
4.17%
1 gen 1996 anni
312.0
+137.0
78.29%
1 gen 1997 anni
454.0
+142.0
45.51%
1 gen 1998 anni
505.0
+51.0
11.23%
1 gen 1999 anni
527.0
+22.0
4.36%
1 gen 2000 anni
538.0
+11.0
2.09%
1 gen 2001 anni
537.0
-1.0
-0.19%
1 gen 2002 anni
699.0
+162.0
30.17%
1 gen 2003 anni
606.0
-93.0
-13.3%
1 gen 2006 anni
675.0
+69.0
11.39%
1 gen 2007 anni
675.0
0.0
0.0%
1 gen 2008 anni
675.0
0.0
0.0%
Classificazione dei paesi secondo i statistiche attuali per anni


Commenti: