29
/it/
it
AIzaSyAYiBZKx7MnpbEhh9jyipgxe19OcubqV5w
April 1, 2024
112517
Costa Rica
CRI
true
2
1
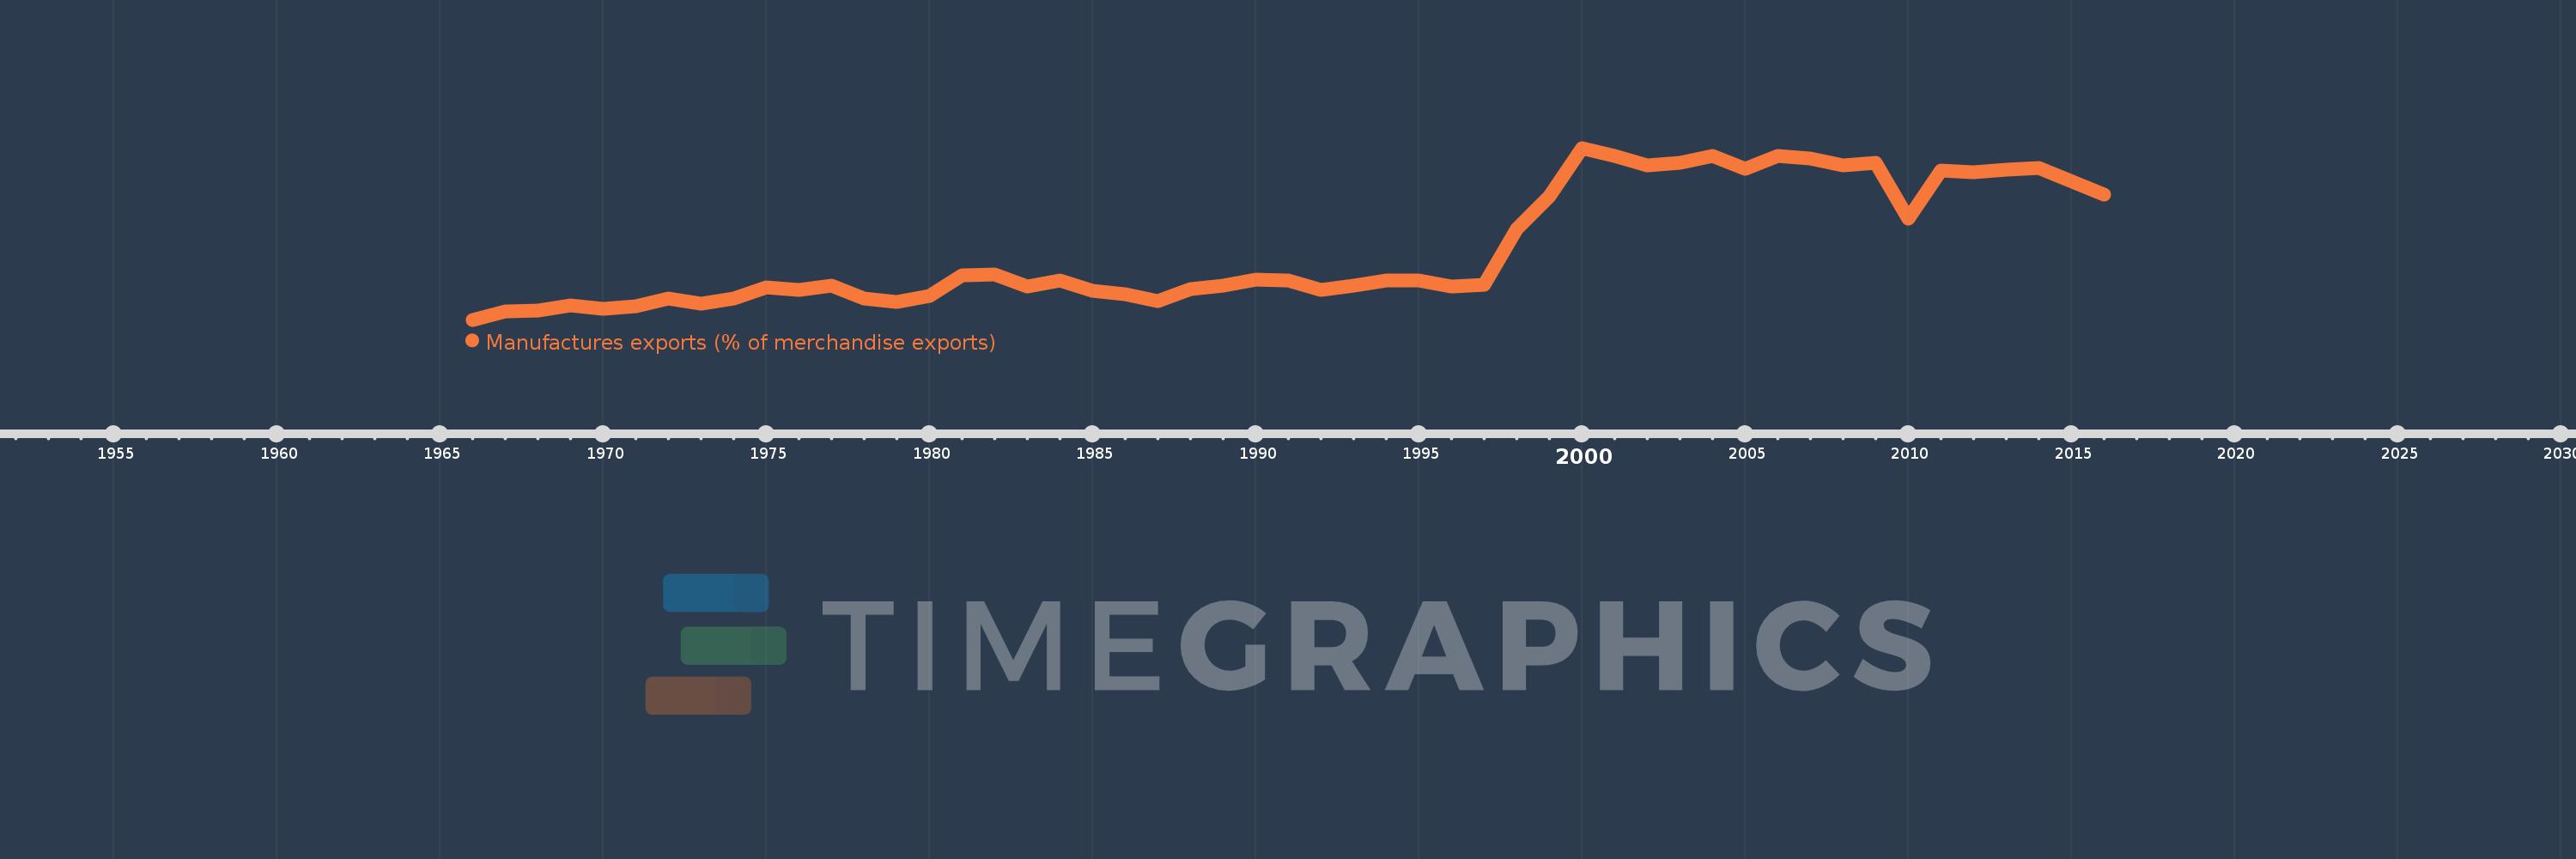
Manufactures exports (% of merchandise exports)
2016,2014,2013,2012,2011,2010,2009,2008,2007,2006,2005,2004,2003,2002,2001,2000,1999,1998,1997,1996,1995,1994,1993,1992,1991,1990,1989,1988,1987,1986,1985,1984,1983,1982,1981,1980,1979,1978,1977,1976,1975,1974,1973,1972,1971,1970,1969,1968,1967,1966
Queste statistiche in altri paesi:
AfghanistanAlbaniaAlgeriaAndorraAngolaAntigua and BarbudaArab WorldArgentinaArmeniaArubaAustraliaAustriaAzerbaijanBahamas, TheBahrainBangladeshBarbadosBelarusBelgiumBelizeBeninBermudaBhutanBoliviaBosnia and HerzegovinaBotswanaBrazilBrunei DarussalamBulgariaBurkina FasoBurundiCabo VerdeCambodiaCameroonCanadaCaribbean small statesCayman IslandsCentral African RepublicCentral Europe and the BalticsChadChileChinaColombiaComorosCongo, Dem. Rep.Congo, Rep.Costa RicaCote d'IvoireCroatiaCubaCyprusCzech RepublicDenmarkDjiboutiDominicaDominican RepublicEarly-demographic dividendEast Asia & PacificEast Asia & Pacific (excluding high income)East Asia & Pacific (IDA & IBRD countries)EcuadorEgypt, Arab Rep.El SalvadorEquatorial GuineaEritreaEstoniaEthiopiaEuro areaEurope & Central AsiaEurope & Central Asia (excluding high income)Europe & Central Asia (IDA & IBRD countries)European UnionFaroe IslandsFijiFinlandFragile and conflict affected situationsFranceFrench PolynesiaGabonGambia, TheGeorgiaGermanyGhanaGreeceGreenlandGrenadaGuatemalaGuineaGuinea-BissauGuyanaHaitiHeavily indebted poor countries (HIPC)High incomeHondurasHong Kong SAR, ChinaHungaryIBRD onlyIcelandIDA & IBRD totalIDA blendIDA onlyIDA totalIndiaIndonesiaIran, Islamic Rep.IraqIrelandIsraelItalyJamaicaJapanJordanKazakhstanKenyaKiribatiKorea, Rep.KuwaitKyrgyz RepublicLao PDRLate-demographic dividendLatin America & Caribbean Latin America & Caribbean (excluding high income)Latin America & the Caribbean (IDA & IBRD countries)LatviaLeast developed countries: UN classificationLebanonLesothoLiberiaLibyaLithuaniaLow & middle incomeLower middle incomeLuxembourgMacao SAR, ChinaMacedonia, FYRMadagascarMalawiMalaysiaMaldivesMaliMaltaMauritaniaMauritiusMexicoMiddle East & North AfricaMiddle East & North Africa (excluding high income)Middle East & North Africa (IDA & IBRD countries)Middle incomeMoldovaMongoliaMoroccoMozambiqueMyanmarNamibiaNepalNetherlandsNew CaledoniaNew ZealandNicaraguaNigerNigeriaNorth AmericaNorwayOECD membersOmanOther small statesPacific island small statesPakistanPalauPanamaPapua New GuineaParaguayPeruPhilippinesPolandPortugalPost-demographic dividendPre-demographic dividendQatarRomaniaRussian FederationRwandaSamoaSao Tome and PrincipeSaudi ArabiaSenegalSerbiaSeychellesSierra LeoneSingaporeSlovak RepublicSloveniaSmall statesSolomon IslandsSomaliaSouth AfricaSouth AsiaSouth Asia (IDA & IBRD)SpainSri LankaSt. Kitts and NevisSt. LuciaSt. Vincent and the GrenadinesSub-Saharan Africa Sub-Saharan Africa (excluding high income)Sub-Saharan Africa (IDA & IBRD countries)SudanSurinameSwazilandSwedenSwitzerlandSyrian Arab RepublicTajikistanTanzaniaThailandTimor-LesteTogoTongaTrinidad and TobagoTunisiaTurkeyTurkmenistanTurks and Caicos IslandsTuvaluUgandaUkraineUnited Arab EmiratesUnited KingdomUnited StatesUpper middle incomeUruguayVanuatuVenezuela, RBVietnamVirgin Islands (U.S.)WorldYemen, Rep.ZambiaZimbabwe Linea del tempo:
Questa scala temporale mostra un grafico dal 1966 anno al 2016 anno. Costa Rica. I dati fino ad 1965 anno non disponibili. Il numero di osservazioni attuali secondo i date: 50.
La fonte (nome):
Indicatori dello sviluppo mondiale
La fonte (organizzazione):
World Bank staff estimates from the Comtrade database maintained by the United Nations Statistics Division.
Categorie:
Private Sector, Trade
sono stati aggiornati
23 apr 2017 anni
Indicatori delle variazioni dei valori per anni
Minima:
14.59
1 gen 1966 anni
Massimo:
68.016
1 gen 2000 anni
Alla data di osservazione
Valore
Variazione assoluta
La variazione rispetto al valore precedente
1 gen 1966 anni
14.59
+14.59
0.0%
1 gen 1967 anni
17.181
+2.592
17.76%
1 gen 1968 anni
17.485
+0.304
1.77%
1 gen 1969 anni
18.984
+1.499
8.57%
1 gen 1970 anni
18.044
-0.94
-4.95%
1 gen 1971 anni
18.655
+0.611
3.39%
1 gen 1972 anni
21.289
+2.635
14.12%
1 gen 1973 anni
19.475
-1.814
-8.52%
1 gen 1974 anni
21.24
+1.765
9.06%
1 gen 1975 anni
24.711
+3.471
16.34%
1 gen 1976 anni
23.901
-0.811
-3.28%
1 gen 1977 anni
25.237
+1.336
5.59%
1 gen 1978 anni
21.096
-4.141
-16.41%
1 gen 1979 anni
20.213
-0.882
-4.18%
1 gen 1980 anni
22.025
+1.811
8.96%
1 gen 1981 anni
28.318
+6.294
28.58%
1 gen 1982 anni
28.794
+0.476
1.68%
1 gen 1983 anni
25.016
-3.778
-13.12%
1 gen 1984 anni
26.922
+1.906
7.62%
1 gen 1985 anni
23.513
-3.408
-12.66%
1 gen 1986 anni
22.404
-1.11
-4.72%
1 gen 1987 anni
20.5
-1.904
-8.5%
1 gen 1988 anni
24.212
+3.712
18.11%
1 gen 1989 anni
25.324
+1.112
4.59%
1 gen 1990 anni
27.098
+1.774
7.0%
1 gen 1991 anni
26.806
-0.291
-1.08%
1 gen 1992 anni
23.979
-2.827
-10.55%
1 gen 1993 anni
25.248
+1.269
5.29%
1 gen 1994 anni
26.882
+1.634
6.47%
1 gen 1995 anni
26.824
-0.059
-0.22%
1 gen 1996 anni
25.056
-1.768
-6.59%
1 gen 1997 anni
25.353
+0.297
1.19%
1 gen 1998 anni
42.902
+17.549
69.22%
1 gen 1999 anni
52.851
+9.949
23.19%
1 gen 2000 anni
68.016
+15.166
28.7%
1 gen 2001 anni
65.566
-2.451
-3.6%
1 gen 2002 anni
62.465
-3.101
-4.73%
1 gen 2003 anni
63.402
+0.937
1.5%
1 gen 2004 anni
65.529
+2.127
3.35%
1 gen 2005 anni
61.625
-3.904
-5.96%
1 gen 2006 anni
65.555
+3.93
6.38%
1 gen 2007 anni
64.863
-0.692
-1.06%
1 gen 2008 anni
62.692
-2.171
-3.35%
1 gen 2009 anni
63.264
+0.572
0.91%
1 gen 2010 anni
45.994
-17.27
-27.3%
1 gen 2011 anni
60.873
+14.879
32.35%
1 gen 2012 anni
60.406
-0.467
-0.77%
1 gen 2013 anni
61.198
+0.792
1.31%
1 gen 2014 anni
61.861
+0.663
1.08%
1 gen 2016 anni
53.559
-8.301
-13.42%
Classificazione dei paesi secondo i statistiche attuali per anni


Commenti: