29
/it/
it
AIzaSyAYiBZKx7MnpbEhh9jyipgxe19OcubqV5w
April 1, 2024
110542
Congo, Rep.
COG
true
2
1
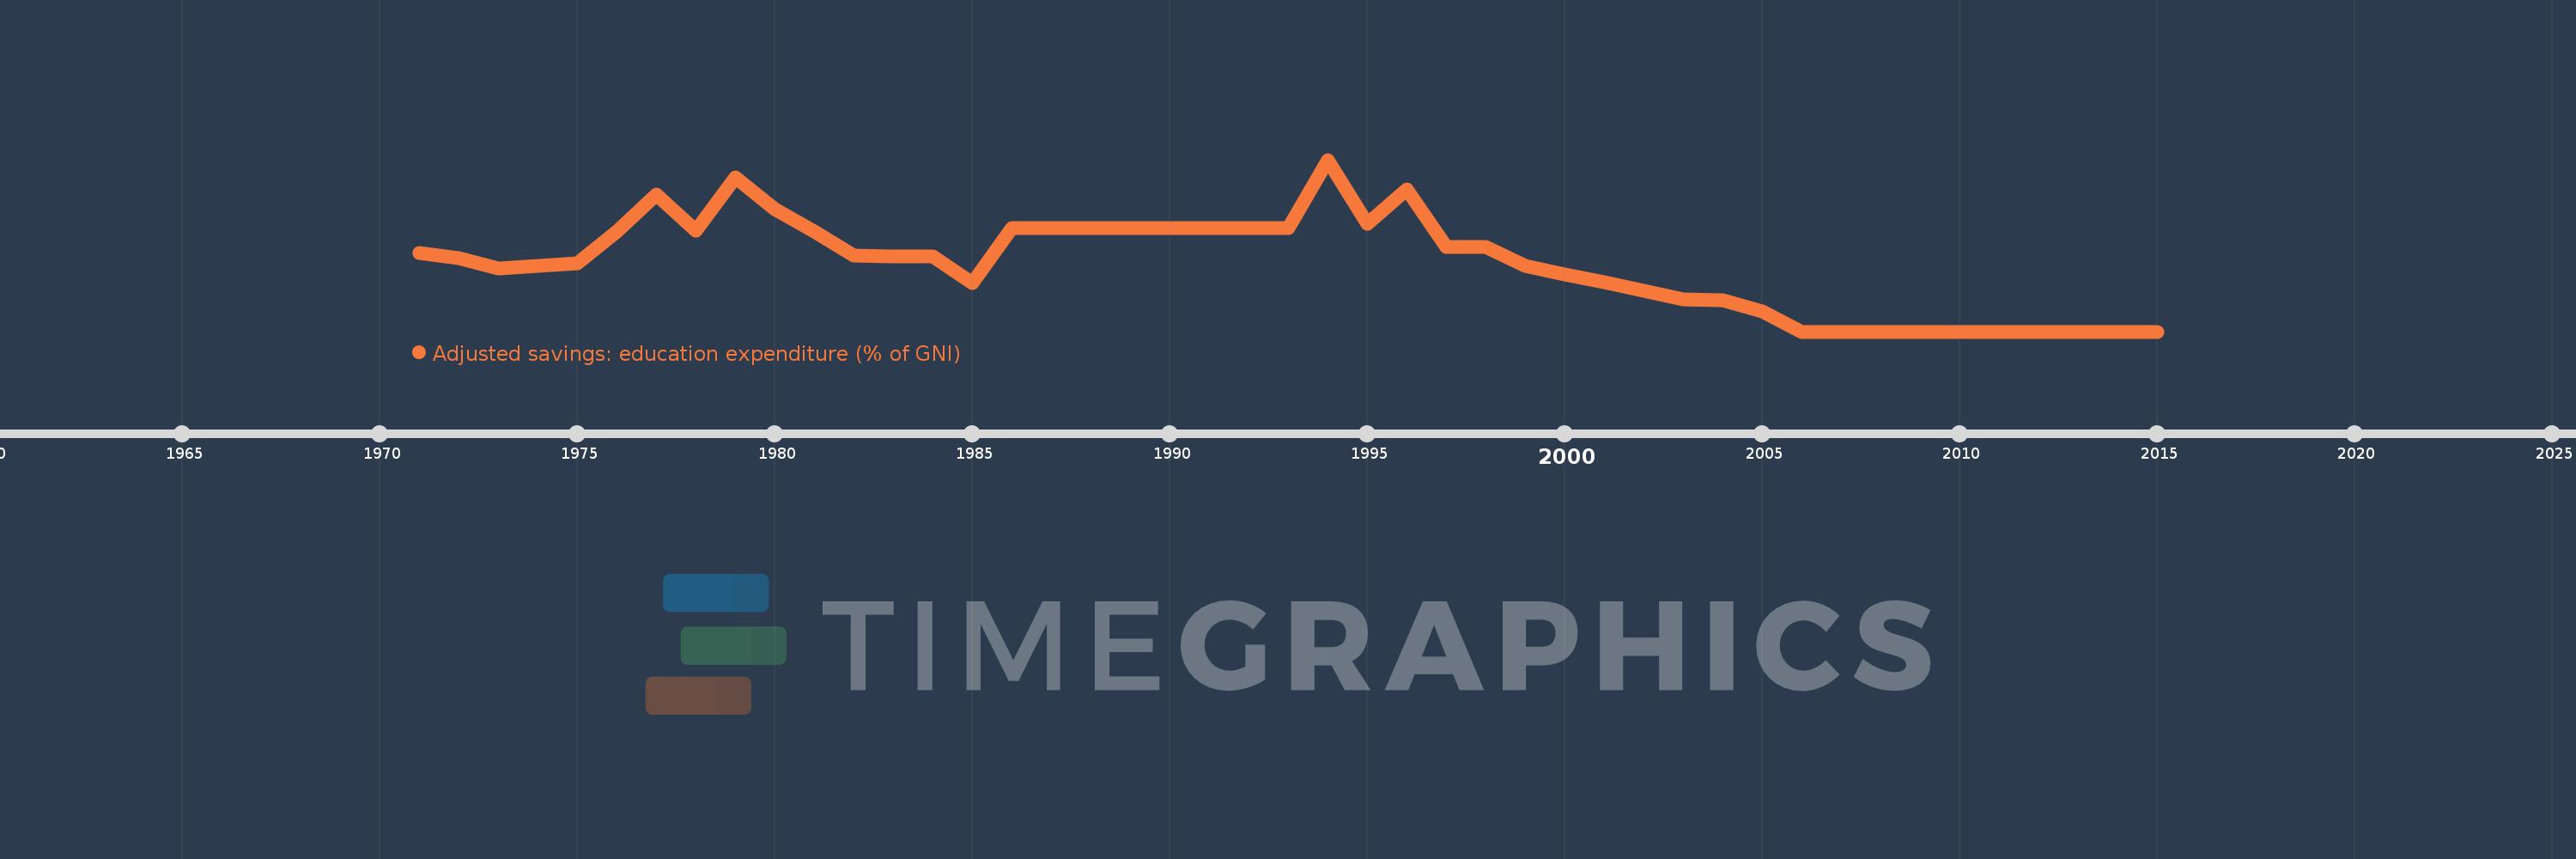
Adjusted savings: education expenditure (% of GNI)
2015,2014,2013,2012,2011,2010,2009,2008,2007,2006,2005,2004,2003,2002,2001,2000,1999,1998,1997,1996,1995,1994,1993,1992,1991,1990,1989,1988,1987,1986,1985,1984,1983,1982,1981,1980,1979,1978,1977,1976,1975,1974,1973,1972,1971
Queste statistiche in altri paesi:
AfghanistanAlbaniaAlgeriaAmerican SamoaAndorraAngolaAntigua and BarbudaArab WorldArgentinaArmeniaAustraliaAustriaAzerbaijanBahamas, TheBahrainBangladeshBarbadosBelarusBelgiumBelizeBeninBermudaBhutanBoliviaBotswanaBrazilBrunei DarussalamBulgariaBurkina FasoBurundiCabo VerdeCambodiaCameroonCanadaCaribbean small statesCentral African RepublicCentral Europe and the BalticsChadChileChinaColombiaComorosCongo, Dem. Rep.Congo, Rep.Costa RicaCote d'IvoireCroatiaCubaCyprusCzech RepublicDenmarkDjiboutiDominicaDominican RepublicEarly-demographic dividendEast Asia & PacificEast Asia & Pacific (excluding high income)East Asia & Pacific (IDA & IBRD countries)EcuadorEgypt, Arab Rep.El SalvadorEquatorial GuineaEritreaEstoniaEthiopiaEuro areaEurope & Central AsiaEurope & Central Asia (excluding high income)Europe & Central Asia (IDA & IBRD countries)European UnionFijiFinlandFragile and conflict affected situationsFranceFrench PolynesiaGabonGambia, TheGeorgiaGermanyGhanaGreeceGrenadaGuatemalaGuineaGuinea-BissauGuyanaHaitiHeavily indebted poor countries (HIPC)High incomeHondurasHong Kong SAR, ChinaHungaryIBRD onlyIcelandIDA & IBRD totalIDA blendIDA onlyIDA totalIndiaIndonesiaIran, Islamic Rep.IraqIrelandIsraelItalyJamaicaJapanJordanKazakhstanKenyaKiribatiKorea, Rep.KuwaitKyrgyz RepublicLao PDRLate-demographic dividendLatin America & Caribbean Latin America & Caribbean (excluding high income)Latin America & the Caribbean (IDA & IBRD countries)LatviaLeast developed countries: UN classificationLebanonLesothoLiberiaLibyaLiechtensteinLithuaniaLow & middle incomeLow incomeLower middle incomeLuxembourgMacao SAR, ChinaMacedonia, FYRMadagascarMalawiMalaysiaMaldivesMaliMaltaMarshall IslandsMauritaniaMauritiusMexicoMicronesia, Fed. Sts.Middle East & North AfricaMiddle East & North Africa (excluding high income)Middle East & North Africa (IDA & IBRD countries)Middle incomeMoldovaMonacoMongoliaMoroccoMozambiqueMyanmarNamibiaNepalNetherlandsNew CaledoniaNew ZealandNicaraguaNigerNigeriaNorth AmericaNorwayOECD membersOmanOther small statesPacific island small statesPakistanPanamaPapua New GuineaParaguayPeruPhilippinesPolandPortugalPost-demographic dividendPre-demographic dividendPuerto RicoQatarRomaniaRussian FederationRwandaSamoaSan MarinoSao Tome and PrincipeSaudi ArabiaSenegalSerbiaSeychellesSierra LeoneSingaporeSlovak RepublicSloveniaSmall statesSolomon IslandsSomaliaSouth AfricaSouth AsiaSouth Asia (IDA & IBRD)SpainSri LankaSt. Kitts and NevisSt. LuciaSt. Vincent and the GrenadinesSub-Saharan Africa Sub-Saharan Africa (excluding high income)Sub-Saharan Africa (IDA & IBRD countries)SudanSurinameSwazilandSwedenSwitzerlandSyrian Arab RepublicTajikistanTanzaniaThailandTimor-LesteTogoTongaTrinidad and TobagoTunisiaTurkeyTurkmenistanUgandaUkraineUnited KingdomUnited StatesUpper middle incomeUruguayUzbekistanVanuatuVenezuela, RBVietnamVirgin Islands (U.S.)WorldYemen, Rep.ZambiaZimbabwe Linea del tempo:
Questa scala temporale mostra un grafico dal 1971 anno al 2015 anno. Congo, Rep.. I dati fino ad 1970 anno non disponibili. Il numero di osservazioni attuali secondo i date: 45.
La fonte (nome):
Indicatori dello sviluppo mondiale
La fonte (organizzazione):
World Bank staff estimates using data from the United Nations Statistics Division's Statistical Yearbook, and the UNESCO Institute for Statistics online database.
Categorie:
Economy & Growth, Environment
sono stati aggiornati
23 apr 2017 anni
Indicatori delle variazioni dei valori per anni
Minima:
2.52
1 gen 2006 anni
Massimo:
9.5
1 gen 1994 anni
Alla data di osservazione
Valore
Variazione assoluta
La variazione rispetto al valore precedente
1 gen 1971 anni
5.7
+5.7
0.0%
1 gen 1972 anni
5.5
-0.2
-3.51%
1 gen 1973 anni
5.1
-0.4
-7.27%
1 gen 1974 anni
5.2
+0.1
1.96%
1 gen 1975 anni
5.3
+0.1
1.92%
1 gen 1976 anni
6.6
+1.3
24.53%
1 gen 1977 anni
8.1
+1.5
22.73%
1 gen 1978 anni
6.631
-1.469
-18.14%
1 gen 1979 anni
8.8
+2.169
32.71%
1 gen 1980 anni
7.5
-1.3
-14.77%
1 gen 1981 anni
6.6
-0.9
-12.0%
1 gen 1982 anni
5.6
-1.0
-15.15%
1 gen 1983 anni
5.569
-0.031
-0.55%
1 gen 1984 anni
5.569
0.0
0.0%
1 gen 1985 anni
4.5
-1.069
-19.2%
1 gen 1986 anni
6.733
+2.233
49.63%
1 gen 1987 anni
6.733
0.0
0.0%
1 gen 1988 anni
6.733
0.0
0.0%
1 gen 1989 anni
6.733
0.0
0.0%
1 gen 1990 anni
6.733
0.0
0.0%
1 gen 1991 anni
6.733
0.0
0.0%
1 gen 1992 anni
6.733
0.0
0.0%
1 gen 1993 anni
6.733
0.0
0.0%
1 gen 1994 anni
9.5
+2.767
41.09%
1 gen 1995 anni
6.9
-2.6
-27.37%
1 gen 1996 anni
8.3
+1.4
20.29%
1 gen 1997 anni
5.95
-2.35
-28.32%
1 gen 1998 anni
5.95
0.0
0.0%
1 gen 1999 anni
5.2
-0.75
-12.6%
1 gen 2000 anni
4.857
-0.343
-6.59%
1 gen 2001 anni
4.515
-0.343
-7.05%
1 gen 2002 anni
4.172
-0.342
-7.59%
1 gen 2003 anni
3.83
-0.342
-8.21%
1 gen 2004 anni
3.78
-0.05
-1.31%
1 gen 2005 anni
3.33
-0.45
-11.9%
1 gen 2006 anni
2.52
-0.81
-24.32%
1 gen 2007 anni
2.52
0.0
0.0%
1 gen 2008 anni
2.52
0.0
0.0%
1 gen 2009 anni
2.52
0.0
0.0%
1 gen 2010 anni
2.52
0.0
0.0%
1 gen 2011 anni
2.52
0.0
0.0%
1 gen 2012 anni
2.52
0.0
0.0%
1 gen 2013 anni
2.52
0.0
0.0%
1 gen 2014 anni
2.52
0.0
0.0%
1 gen 2015 anni
2.52
0.0
0.0%
Classificazione dei paesi secondo i statistiche attuali per anni


Commenti: