29
/it/
it
AIzaSyAYiBZKx7MnpbEhh9jyipgxe19OcubqV5w
April 1, 2024
107116
Colombia
COL
true
2
1
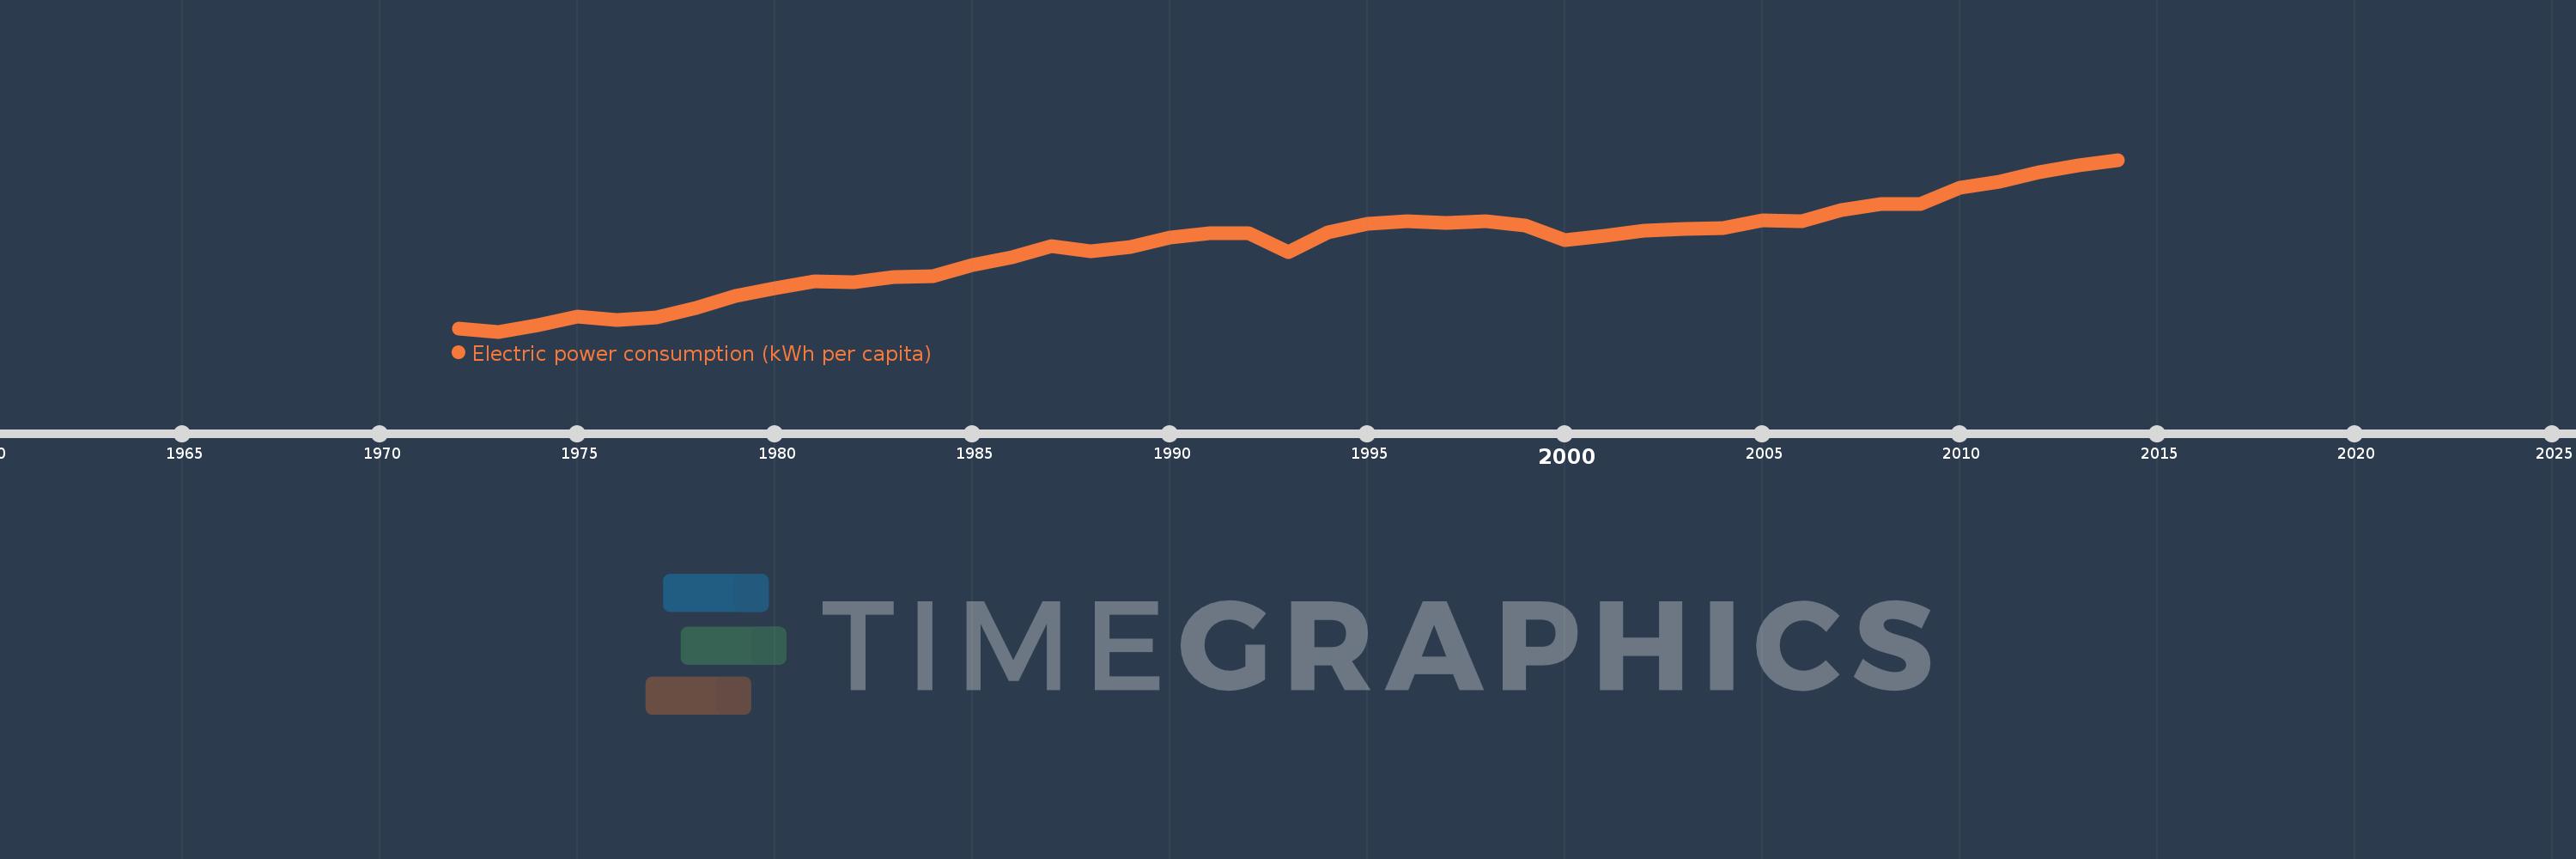
Electric power consumption (kWh per capita)
2014,2013,2012,2011,2010,2009,2008,2007,2006,2005,2004,2003,2002,2001,2000,1999,1998,1997,1996,1995,1994,1993,1992,1991,1990,1989,1988,1987,1986,1985,1984,1983,1982,1981,1980,1979,1978,1977,1976,1975,1974,1973,1972
Queste statistiche in altri paesi:
AlbaniaAlgeriaAngolaArab WorldArgentinaArmeniaAustraliaAustriaAzerbaijanBahrainBangladeshBelarusBelgiumBeninBoliviaBosnia and HerzegovinaBotswanaBrazilBrunei DarussalamBulgariaCambodiaCameroonCanadaCentral Europe and the BalticsChileChinaColombiaCongo, Dem. Rep.Congo, Rep.Costa RicaCote d'IvoireCroatiaCubaCuracaoCyprusCzech RepublicDenmarkDominican RepublicEarly-demographic dividendEast Asia & PacificEast Asia & Pacific (excluding high income)East Asia & Pacific (IDA & IBRD countries)EcuadorEgypt, Arab Rep.El SalvadorEritreaEstoniaEthiopiaEuro areaEurope & Central AsiaEurope & Central Asia (excluding high income)Europe & Central Asia (IDA & IBRD countries)European UnionFinlandFragile and conflict affected situationsFranceGabonGeorgiaGermanyGhanaGibraltarGreeceGuatemalaHaitiHeavily indebted poor countries (HIPC)High incomeHondurasHong Kong SAR, ChinaHungaryIBRD onlyIcelandIDA & IBRD totalIDA blendIDA onlyIDA totalIndiaIndonesiaIran, Islamic Rep.IraqIrelandIsraelItalyJamaicaJapanJordanKazakhstanKenyaKorea, Dem. People’s Rep.Korea, Rep.KosovoKuwaitKyrgyz RepublicLate-demographic dividendLatin America & Caribbean Latin America & Caribbean (excluding high income)Latin America & the Caribbean (IDA & IBRD countries)LatviaLeast developed countries: UN classificationLebanonLibyaLithuaniaLow & middle incomeLower middle incomeLuxembourgMacedonia, FYRMalaysiaMaltaMauritiusMexicoMiddle East & North AfricaMiddle East & North Africa (excluding high income)Middle East & North Africa (IDA & IBRD countries)Middle incomeMoldovaMongoliaMontenegroMoroccoMozambiqueMyanmarNamibiaNepalNetherlandsNew ZealandNicaraguaNigerNigeriaNorth AmericaNorwayOECD membersOmanPakistanPanamaParaguayPeruPhilippinesPolandPortugalPost-demographic dividendPre-demographic dividendQatarRomaniaRussian FederationSaudi ArabiaSenegalSerbiaSingaporeSlovak RepublicSloveniaSouth AfricaSouth AsiaSouth Asia (IDA & IBRD)South SudanSpainSri LankaSub-Saharan Africa Sub-Saharan Africa (excluding high income)Sub-Saharan Africa (IDA & IBRD countries)SudanSwedenSwitzerlandSyrian Arab RepublicTajikistanTanzaniaThailandTogoTrinidad and TobagoTunisiaTurkeyTurkmenistanUkraineUnited Arab EmiratesUnited KingdomUnited StatesUpper middle incomeUruguayUzbekistanVenezuela, RBVietnamWorldYemen, Rep.ZambiaZimbabwe Linea del tempo:
Questa scala temporale mostra un grafico dal 1972 anno al 2014 anno. Colombia. I dati fino ad 1971 anno non disponibili. Il numero di osservazioni attuali secondo i date: 43.
La fonte (nome):
Indicatori dello sviluppo mondiale
La fonte (organizzazione):
IEA Statistics © OECD/IEA 2014 (http://www.iea.org/stats/index.asp), subject to https://www.iea.org/t&c/termsandconditions/
Categorie:
Energy & Mining, Climate Change, Infrastructure
sono stati aggiornati
23 apr 2017 anni
Indicatori delle variazioni dei valori per anni
Minima:
389.471
1 gen 1973 anni
Massimo:
1.177 Mille.
1 gen 2014 anni
Alla data di osservazione
Valore
Variazione assoluta
La variazione rispetto al valore precedente
1 gen 1972 anni
403.635
+403.635
0.0%
1 gen 1973 anni
389.471
-14.165
-3.51%
1 gen 1974 anni
420.832
+31.362
8.05%
1 gen 1975 anni
459.269
+38.437
9.13%
1 gen 1976 anni
441.653
-17.616
-3.84%
1 gen 1977 anni
456.179
+14.525
3.29%
1 gen 1978 anni
498.241
+42.063
9.22%
1 gen 1979 anni
551.691
+53.449
10.73%
1 gen 1980 anni
589.374
+37.683
6.83%
1 gen 1981 anni
618.035
+28.661
4.86%
1 gen 1982 anni
614.604
-3.431
-0.56%
1 gen 1983 anni
638.333
+23.729
3.86%
1 gen 1984 anni
642.299
+3.966
0.62%
1 gen 1985 anni
696.176
+53.877
8.39%
1 gen 1986 anni
729.37
+33.194
4.77%
1 gen 1987 anni
781.281
+51.911
7.12%
1 gen 1988 anni
757.696
-23.585
-3.02%
1 gen 1989 anni
776.485
+18.789
2.48%
1 gen 1990 anni
821.932
+45.447
5.85%
1 gen 1991 anni
841.864
+19.932
2.43%
1 gen 1992 anni
842.289
+0.425
0.05%
1 gen 1993 anni
753.824
-88.464
-10.5%
1 gen 1994 anni
846.19
+92.366
12.25%
1 gen 1995 anni
883.973
+37.782
4.46%
1 gen 1996 anni
895.385
+11.413
1.29%
1 gen 1997 anni
887.802
-7.584
-0.85%
1 gen 1998 anni
895.863
+8.062
0.91%
1 gen 1999 anni
874.444
-21.419
-2.39%
1 gen 2000 anni
810.688
-63.757
-7.29%
1 gen 2001 anni
829.399
+18.711
2.31%
1 gen 2002 anni
850.425
+21.026
2.54%
1 gen 2003 anni
858.621
+8.195
0.96%
1 gen 2004 anni
862.518
+3.898
0.45%
1 gen 2005 anni
898.344
+35.826
4.15%
1 gen 2006 anni
895.817
-2.527
-0.28%
1 gen 2007 anni
947.127
+51.31
5.73%
1 gen 2008 anni
974.385
+27.259
2.88%
1 gen 2009 anni
974.218
-0.167
-0.02%
1 gen 2010 anni
1.05 Mille.
+75.758
7.78%
1 gen 2011 anni
1.078 Mille.
+28.008
2.67%
1 gen 2012 anni
1.121 Mille.
+43.411
4.03%
1 gen 2013 anni
1.15 Mille.
+28.558
2.55%
1 gen 2014 anni
1.177 Mille.
+27.153
2.36%
Classificazione dei paesi secondo i statistiche attuali per anni


Commenti: