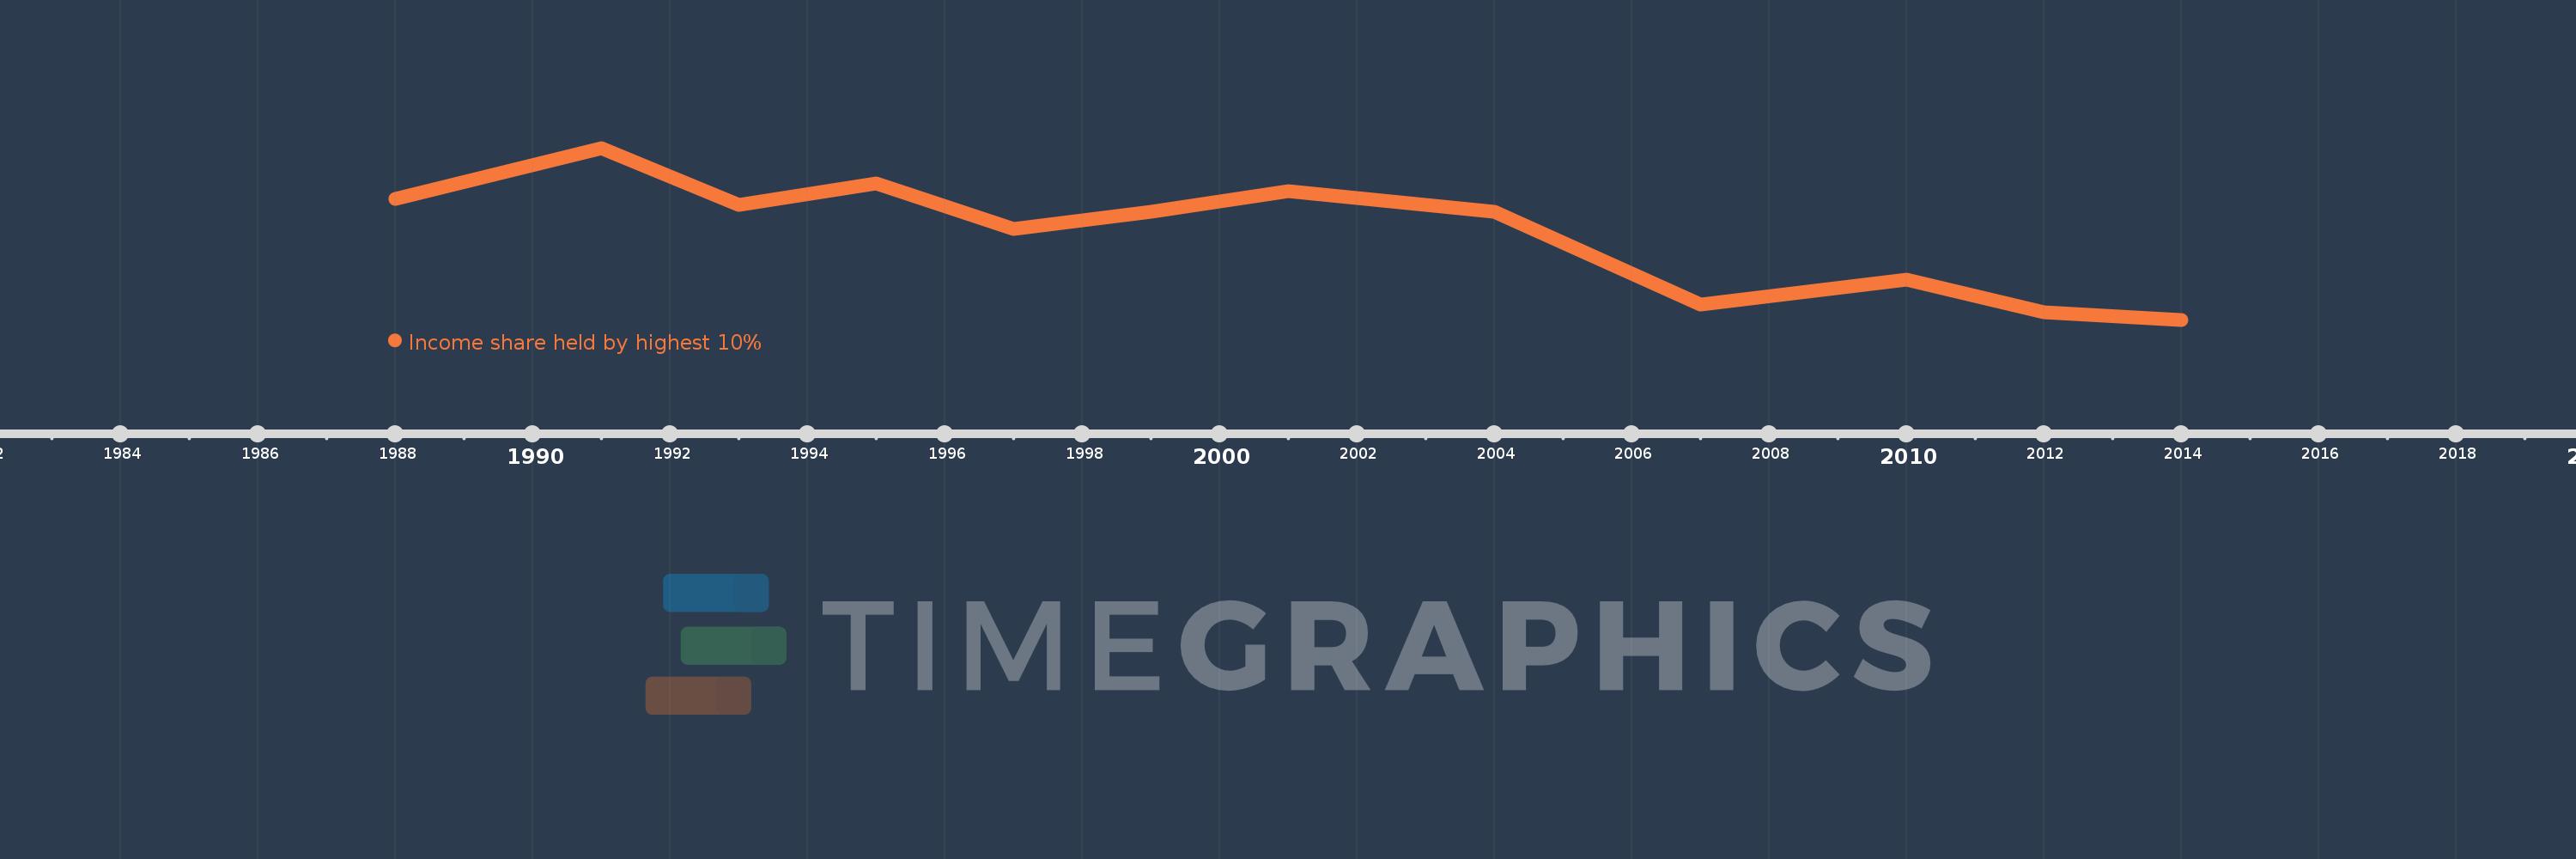
Questa scala temporale mostra un grafico dal 1988 anno al 2014 anno. Chile. I dati fino ad 1987 anno non disponibili. Il numero di osservazioni attuali secondo i date: 12.
La fonte (nome):
Indicatori dello sviluppo mondiale
La fonte (organizzazione):
World Bank, Development Research Group. Data are based on primary household survey data obtained from government statistical agencies and World Bank country departments. Data for high-income economies are from the Luxembourg Income Study database. For more information and methodology, please see PovcalNet (http://iresearch.worldbank.org/PovcalNet/index.htm).
Categorie:
Poverty
sono stati aggiornati
23 apr 2017 anni
Indicatori delle variazioni dei valori per anni
In media:
44.289
Minima:
41.47
1 gen 2014 anni
Massimo:
47.05
1 gen 1991 anni
Alla data di osservazione
Valore
Variazione assoluta
La variazione rispetto al valore precedente
1 gen 1988 anni
45.39
+45.39
0.0%
1 gen 1991 anni
47.05
+1.66
3.66%
1 gen 1993 anni
45.2
-1.85
-3.93%
1 gen 1995 anni
45.91
+0.71
1.57%
1 gen 1997 anni
44.43
-1.48
-3.22%
1 gen 1999 anni
44.97
+0.54
1.22%
1 gen 2001 anni
45.64
+0.67
1.49%
1 gen 2004 anni
44.97
-0.67
-1.47%
1 gen 2007 anni
41.96
-3.01
-6.69%
1 gen 2010 anni
42.76
+0.8
1.91%
1 gen 2012 anni
41.72
-1.04
-2.43%
1 gen 2014 anni
41.47
-0.25
-0.6%
Classificazione dei paesi secondo i statistiche attuali per anni
