29
/it/
it
AIzaSyAYiBZKx7MnpbEhh9jyipgxe19OcubqV5w
April 1, 2024
103912
Chad
TCD
true
2
1
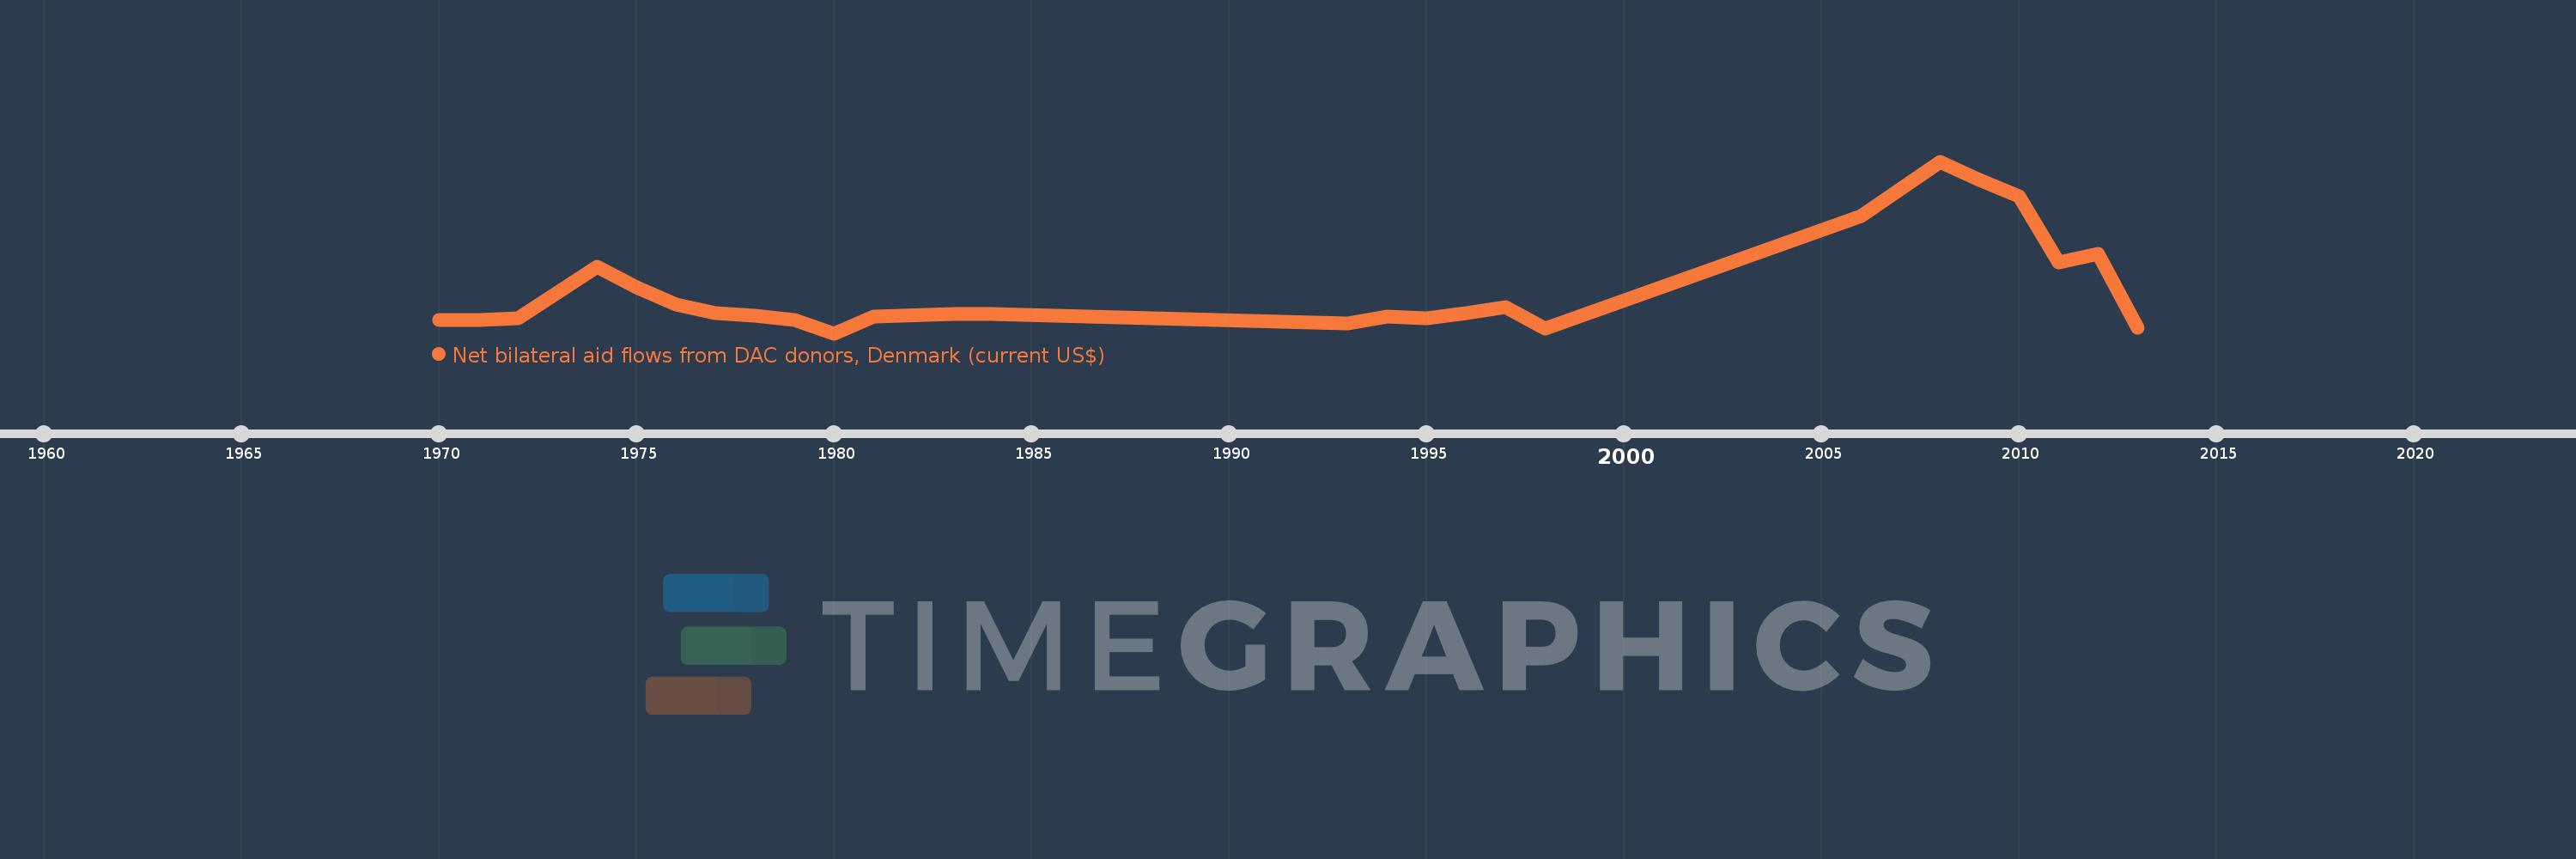
Net bilateral aid flows from DAC donors, Denmark (current US$)
2013,2012,2011,2010,2009,2008,2006,1998,1997,1996,1995,1994,1993,1984,1983,1981,1980,1979,1978,1977,1976,1975,1974,1972,1971,1970
Queste statistiche in altri paesi:
AfghanistanAlbaniaAlgeriaAngolaArab WorldArgentinaArmeniaAzerbaijanBahrainBangladeshBelarusBelizeBeninBhutanBoliviaBosnia and HerzegovinaBotswanaBrazilBulgariaBurkina FasoBurundiCabo VerdeCambodiaCameroonCaribbean small statesCentral African RepublicCentral Europe and the BalticsChadChileChinaColombiaComorosCongo, Dem. Rep.Congo, Rep.Costa RicaCote d'IvoireCroatiaCubaCyprusCzech RepublicDjiboutiDominicaDominican RepublicEast Asia & PacificEast Asia & Pacific (excluding high income)East Asia & Pacific (IDA & IBRD countries)EcuadorEgypt, Arab Rep.El SalvadorEritreaEstoniaEthiopiaEuro areaEurope & Central AsiaEurope & Central Asia (excluding high income)Europe & Central Asia (IDA & IBRD countries)European UnionFijiFragile and conflict affected situationsGambia, TheGeorgiaGhanaGrenadaGuatemalaGuineaGuinea-BissauGuyanaHaitiHeavily indebted poor countries (HIPC)High incomeHondurasHungaryIBRD onlyIDA & IBRD totalIDA blendIDA onlyIDA totalIndiaIndonesiaIran, Islamic Rep.IraqIsraelJamaicaJordanKazakhstanKenyaKorea, Dem. People’s Rep.Korea, Rep.KosovoKuwaitKyrgyz RepublicLao PDRLatin America & Caribbean Latin America & Caribbean (excluding high income)Latin America & the Caribbean (IDA & IBRD countries)LatviaLeast developed countries: UN classificationLebanonLesothoLiberiaLibyaLithuaniaLow & middle incomeLow incomeLower middle incomeMacedonia, FYRMadagascarMalawiMalaysiaMaldivesMaliMaltaMauritaniaMauritiusMexicoMiddle East & North AfricaMiddle East & North Africa (excluding high income)Middle East & North Africa (IDA & IBRD countries)Middle incomeMoldovaMongoliaMontenegroMoroccoMozambiqueMyanmarNamibiaNepalNicaraguaNigerNigeriaOECD membersOmanOther small statesPacific island small statesPakistanPanamaPapua New GuineaParaguayPeruPhilippinesPolandRomaniaRussian FederationRwandaSamoaSenegalSerbiaSeychellesSierra LeoneSingaporeSlovak RepublicSloveniaSmall statesSolomon IslandsSomaliaSouth AfricaSouth AsiaSouth Asia (IDA & IBRD)South SudanSri LankaSub-Saharan Africa Sub-Saharan Africa (excluding high income)Sub-Saharan Africa (IDA & IBRD countries)SudanSwazilandSyrian Arab RepublicTajikistanTanzaniaThailandTimor-LesteTogoTongaTrinidad and TobagoTunisiaTurkeyTurkmenistanUgandaUkraineUpper middle incomeUruguayUzbekistanVanuatuVenezuela, RBVietnamWest Bank and GazaWorldYemen, Rep.ZambiaZimbabwe Linea del tempo:
Questa scala temporale mostra un grafico dal 1970 anno al 2013 anno. Chad. I dati fino ad 1969 anno non disponibili. Il numero di osservazioni attuali secondo i date: 26.
La fonte (nome):
Indicatori dello sviluppo mondiale
La fonte (organizzazione):
Development Assistance Committee of the Organisation for Economic Co-operation and Development, Geographical Distribution of Financial Flows to Developing Countries, Development Co-operation Report, and International Development Statistics database. Data are available online at: www.oecd.org/dac/stats/idsonline.
Categorie:
Aid Effectiveness
sono stati aggiornati
23 apr 2017 anni
Indicatori delle variazioni dei valori per anni
Minima:
-90.0 Mille.
1 gen 1980 anni
Massimo:
1.75 Mln
1 gen 2008 anni
Alla data di osservazione
Valore
Variazione assoluta
La variazione rispetto al valore precedente
1 gen 1970 anni
50.0 Mille.
+50.0 Mille.
0.0%
1 gen 1971 anni
50.0 Mille.
0.0
0.0%
1 gen 1972 anni
70.0 Mille.
+20.0 Mille.
40.0%
1 gen 1974 anni
620.0 Mille.
+550.0 Mille.
785.71%
1 gen 1975 anni
400.0 Mille.
-220.0 Mille.
-35.48%
1 gen 1976 anni
220.0 Mille.
-180.0 Mille.
-45.0%
1 gen 1977 anni
130.0 Mille.
-90.0 Mille.
-40.91%
1 gen 1978 anni
100.0 Mille.
-30.0 Mille.
-23.08%
1 gen 1979 anni
50.0 Mille.
-50.0 Mille.
-50.0%
1 gen 1980 anni
-90.0 Mille.
-140.0 Mille.
-280.0%
1 gen 1981 anni
90.0 Mille.
+180.0 Mille.
-200.0%
1 gen 1983 anni
120.0 Mille.
+30.0 Mille.
33.33%
1 gen 1984 anni
120.0 Mille.
0.0
0.0%
1 gen 1993 anni
20.0 Mille.
-100.0 Mille.
-83.33%
1 gen 1994 anni
90.0 Mille.
+70.0 Mille.
350.0%
1 gen 1995 anni
70.0 Mille.
-20.0 Mille.
-22.22%
1 gen 1996 anni
130.0 Mille.
+60.0 Mille.
85.71%
1 gen 1997 anni
190.0 Mille.
+60.0 Mille.
46.15%
1 gen 1998 anni
-40.0 Mille.
-230.0 Mille.
-121.05%
1 gen 2006 anni
1.17 Mln
+1.21 Mln
-3.02 Mille.%
1 gen 2008 anni
1.75 Mln
+580.0 Mille.
49.57%
1 gen 2009 anni
1.55 Mln
-200.0 Mille.
-11.43%
1 gen 2010 anni
1.38 Mln
-170.0 Mille.
-10.97%
1 gen 2011 anni
670.0 Mille.
-710.0 Mille.
-51.45%
1 gen 2012 anni
760.0 Mille.
+90.0 Mille.
13.43%
1 gen 2013 anni
-30.0 Mille.
-790.0 Mille.
-103.95%
Classificazione dei paesi secondo i statistiche attuali per anni


Commenti: