29
/it/
it
AIzaSyAYiBZKx7MnpbEhh9jyipgxe19OcubqV5w
April 1, 2024
100374
Cameroon
CMR
true
2
1
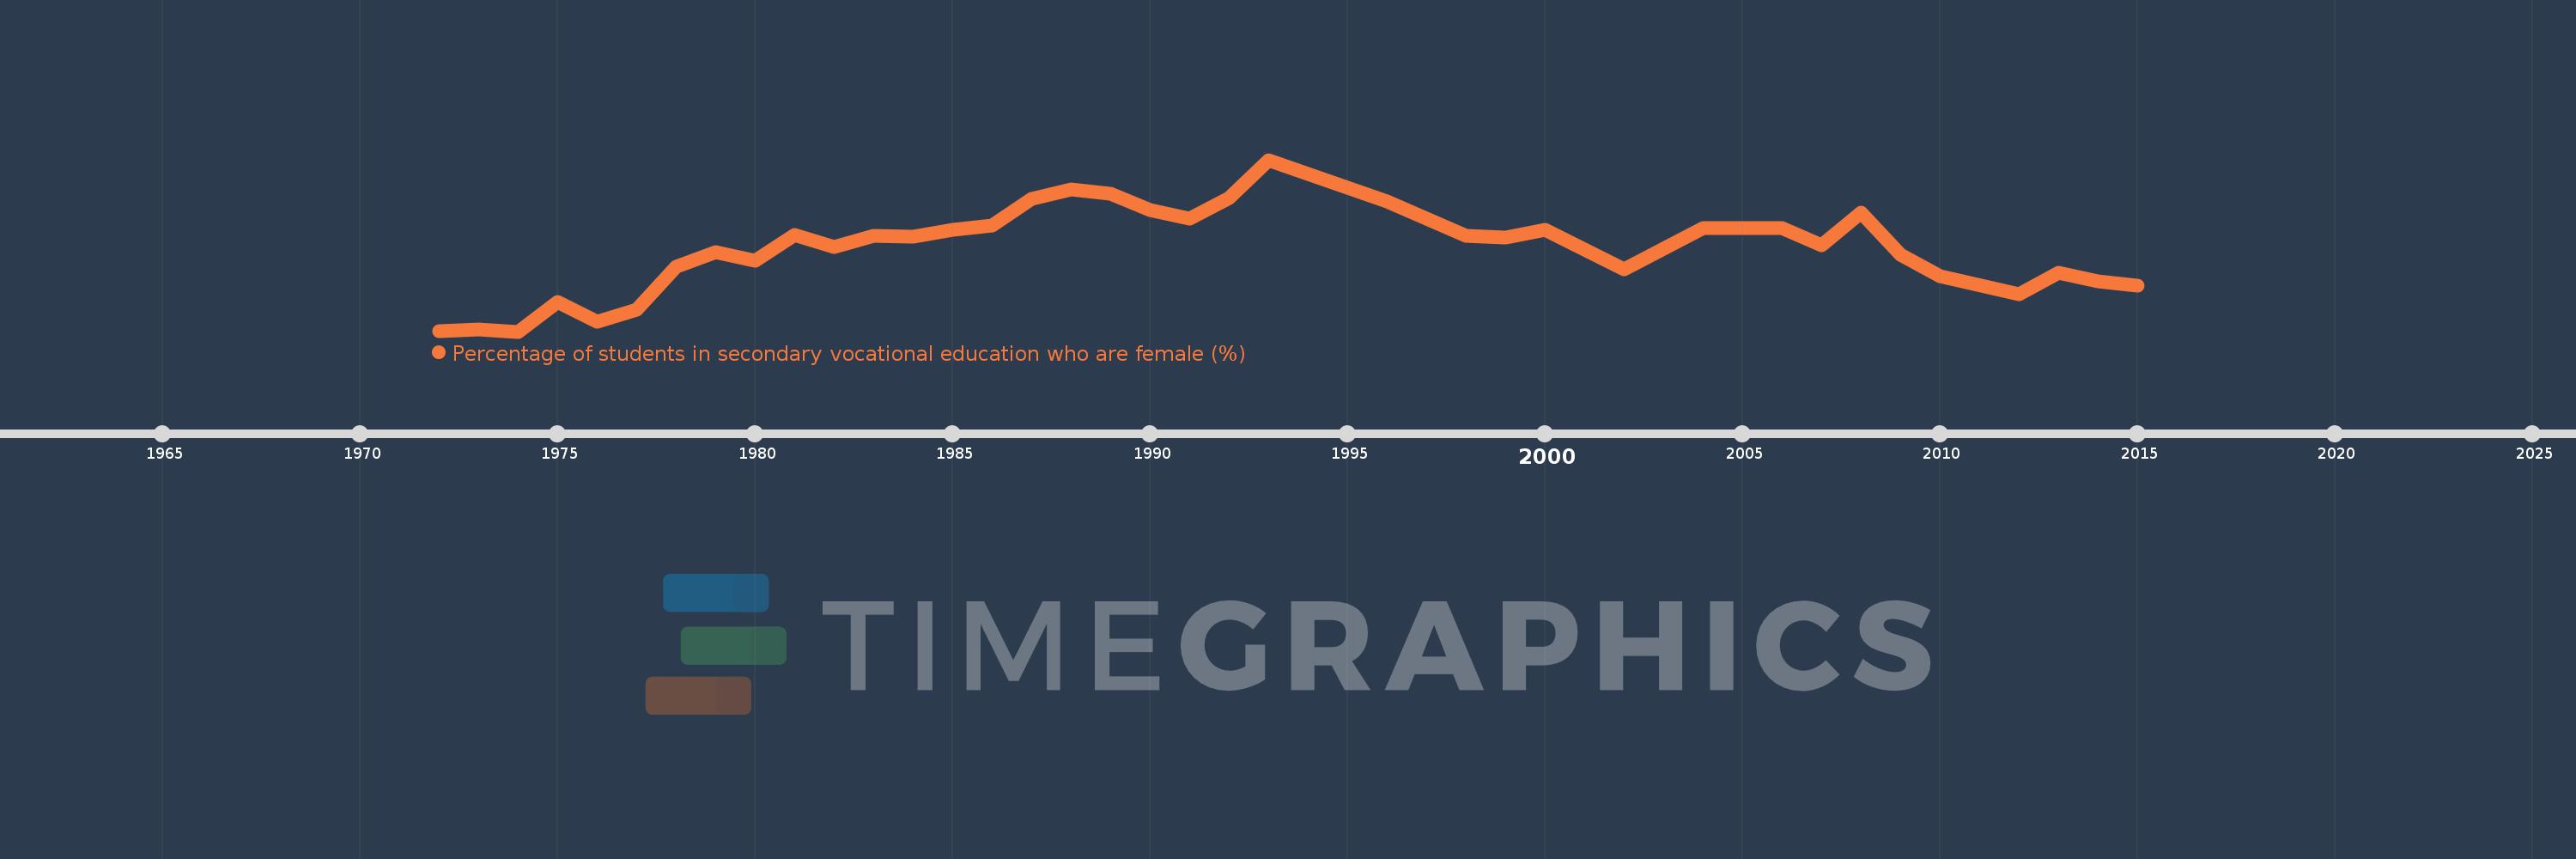
Percentage of students in secondary vocational education who are female (%)
2015,2014,2013,2012,2010,2009,2008,2007,2006,2005,2004,2002,2000,1999,1998,1996,1993,1992,1991,1990,1989,1988,1987,1986,1985,1984,1983,1982,1981,1980,1979,1978,1977,1976,1975,1974,1973,1972
Queste statistiche in altri paesi:
AfghanistanAlbaniaAlgeriaAndorraAngolaAntigua and BarbudaArab WorldArgentinaArmeniaArubaAustraliaAustriaAzerbaijanBahrainBangladeshBarbadosBelarusBelgiumBelizeBeninBermudaBhutanBoliviaBosnia and HerzegovinaBotswanaBrazilBritish Virgin IslandsBrunei DarussalamBulgariaBurkina FasoBurundiCabo VerdeCambodiaCameroonCanadaCaribbean small statesCentral African RepublicCentral Europe and the BalticsChadChileChinaColombiaComorosCongo, Dem. Rep.Congo, Rep.Costa RicaCote d'IvoireCroatiaCubaCuracaoCyprusCzech RepublicDenmarkDjiboutiDominicaDominican RepublicEarly-demographic dividendEast Asia & PacificEast Asia & Pacific (excluding high income)East Asia & Pacific (IDA & IBRD countries)EcuadorEgypt, Arab Rep.El SalvadorEquatorial GuineaEritreaEstoniaEthiopiaEuro areaEurope & Central AsiaEurope & Central Asia (excluding high income)Europe & Central Asia (IDA & IBRD countries)European UnionFijiFinlandFragile and conflict affected situationsFranceGabonGambia, TheGeorgiaGermanyGhanaGibraltarGreeceGrenadaGuatemalaGuineaGuinea-BissauGuyanaHaitiHeavily indebted poor countries (HIPC)High incomeHondurasHong Kong SAR, ChinaHungaryIBRD onlyIcelandIDA & IBRD totalIDA blendIDA onlyIDA totalIndiaIndonesiaIran, Islamic Rep.IraqIrelandIsraelItalyJamaicaJapanJordanKazakhstanKenyaKiribatiKorea, Rep.KuwaitKyrgyz RepublicLao PDRLate-demographic dividendLatin America & Caribbean Latin America & Caribbean (excluding high income)Latin America & the Caribbean (IDA & IBRD countries)LatviaLeast developed countries: UN classificationLebanonLesothoLiberiaLibyaLiechtensteinLithuaniaLow & middle incomeLow incomeLower middle incomeLuxembourgMacao SAR, ChinaMacedonia, FYRMadagascarMalawiMalaysiaMaldivesMaliMaltaMarshall IslandsMauritaniaMauritiusMexicoMicronesia, Fed. Sts.Middle East & North AfricaMiddle East & North Africa (excluding high income)Middle East & North Africa (IDA & IBRD countries)Middle incomeMoldovaMonacoMongoliaMontenegroMoroccoMozambiqueMyanmarNamibiaNauruNepalNetherlandsNew ZealandNicaraguaNigerNigeriaNorth AmericaNorwayOECD membersOmanOther small statesPacific island small statesPakistanPanamaPapua New GuineaParaguayPeruPolandPortugalPost-demographic dividendPre-demographic dividendPuerto RicoQatarRomaniaRussian FederationRwandaSamoaSan MarinoSao Tome and PrincipeSaudi ArabiaSenegalSerbiaSeychellesSierra LeoneSingaporeSint Maarten (Dutch part)Slovak RepublicSloveniaSmall statesSolomon IslandsSomaliaSouth AfricaSouth AsiaSouth Asia (IDA & IBRD)SpainSri LankaSt. Kitts and NevisSt. LuciaSt. Vincent and the GrenadinesSub-Saharan Africa Sub-Saharan Africa (excluding high income)Sub-Saharan Africa (IDA & IBRD countries)SudanSurinameSwazilandSwedenSwitzerlandSyrian Arab RepublicTajikistanTanzaniaThailandTimor-LesteTogoTongaTrinidad and TobagoTunisiaTurkeyTurkmenistanTurks and Caicos IslandsTuvaluUgandaUkraineUnited Arab EmiratesUnited KingdomUpper middle incomeUruguayUzbekistanVanuatuVenezuela, RBVietnamWest Bank and GazaWorldYemen, Rep.ZambiaZimbabwe Linea del tempo:
Questa scala temporale mostra un grafico dal 1972 anno al 2015 anno. Cameroon. I dati fino ad 1971 anno non disponibili. Il numero di osservazioni attuali secondo i date: 38.
La fonte (nome):
Indicatori dello sviluppo mondiale
La fonte (organizzazione):
UNESCO Institute for Statistics
Categorie:
Education, Gender
sono stati aggiornati
23 apr 2017 anni
Indicatori delle variazioni dei valori per anni
Minima:
34.612
1 gen 1974 anni
Massimo:
43.55
1 gen 1993 anni
Alla data di osservazione
Valore
Variazione assoluta
La variazione rispetto al valore precedente
1 gen 1972 anni
34.65
+34.65
0.0%
1 gen 1973 anni
34.72
+0.07
0.2%
1 gen 1974 anni
34.612
-0.108
-0.31%
1 gen 1975 anni
36.132
+1.52
4.39%
1 gen 1976 anni
35.125
-1.007
-2.79%
1 gen 1977 anni
35.73
+0.604
1.72%
1 gen 1978 anni
37.981
+2.251
6.3%
1 gen 1979 anni
38.747
+0.766
2.02%
1 gen 1980 anni
38.316
-0.431
-1.11%
1 gen 1981 anni
39.658
+1.342
3.5%
1 gen 1982 anni
39.02
-0.637
-1.61%
1 gen 1983 anni
39.578
+0.558
1.43%
1 gen 1984 anni
39.533
-0.045
-0.11%
1 gen 1985 anni
39.903
+0.37
0.94%
1 gen 1986 anni
40.14
+0.238
0.6%
1 gen 1987 anni
41.533
+1.393
3.47%
1 gen 1988 anni
42.027
+0.493
1.19%
1 gen 1989 anni
41.795
-0.232
-0.55%
1 gen 1990 anni
40.935
-0.86
-2.06%
1 gen 1991 anni
40.472
-0.463
-1.13%
1 gen 1992 anni
41.577
+1.105
2.73%
1 gen 1993 anni
43.55
+1.973
4.75%
1 gen 1996 anni
41.401
-2.149
-4.94%
1 gen 1998 anni
39.598
-1.803
-4.35%
1 gen 1999 anni
39.504
-0.094
-0.24%
1 gen 2000 anni
39.904
+0.4
1.01%
1 gen 2002 anni
37.845
-2.058
-5.16%
1 gen 2004 anni
40.0
+2.155
5.69%
1 gen 2005 anni
40.0
+0.0
0.0%
1 gen 2006 anni
40.0
0.0
0.0%
1 gen 2007 anni
39.122
-0.878
-2.2%
1 gen 2008 anni
40.802
+1.68
4.29%
1 gen 2009 anni
38.613
-2.189
-5.37%
1 gen 2010 anni
37.497
-1.115
-2.89%
1 gen 2012 anni
36.571
-0.927
-2.47%
1 gen 2013 anni
37.689
+1.118
3.06%
1 gen 2014 anni
37.242
-0.447
-1.19%
1 gen 2015 anni
37.005
-0.237
-0.64%
Classificazione dei paesi secondo i statistiche attuali per anni


Commenti: