29
/it/
it
AIzaSyAYiBZKx7MnpbEhh9jyipgxe19OcubqV5w
April 1, 2024
100086
Cameroon
CMR
true
2
1
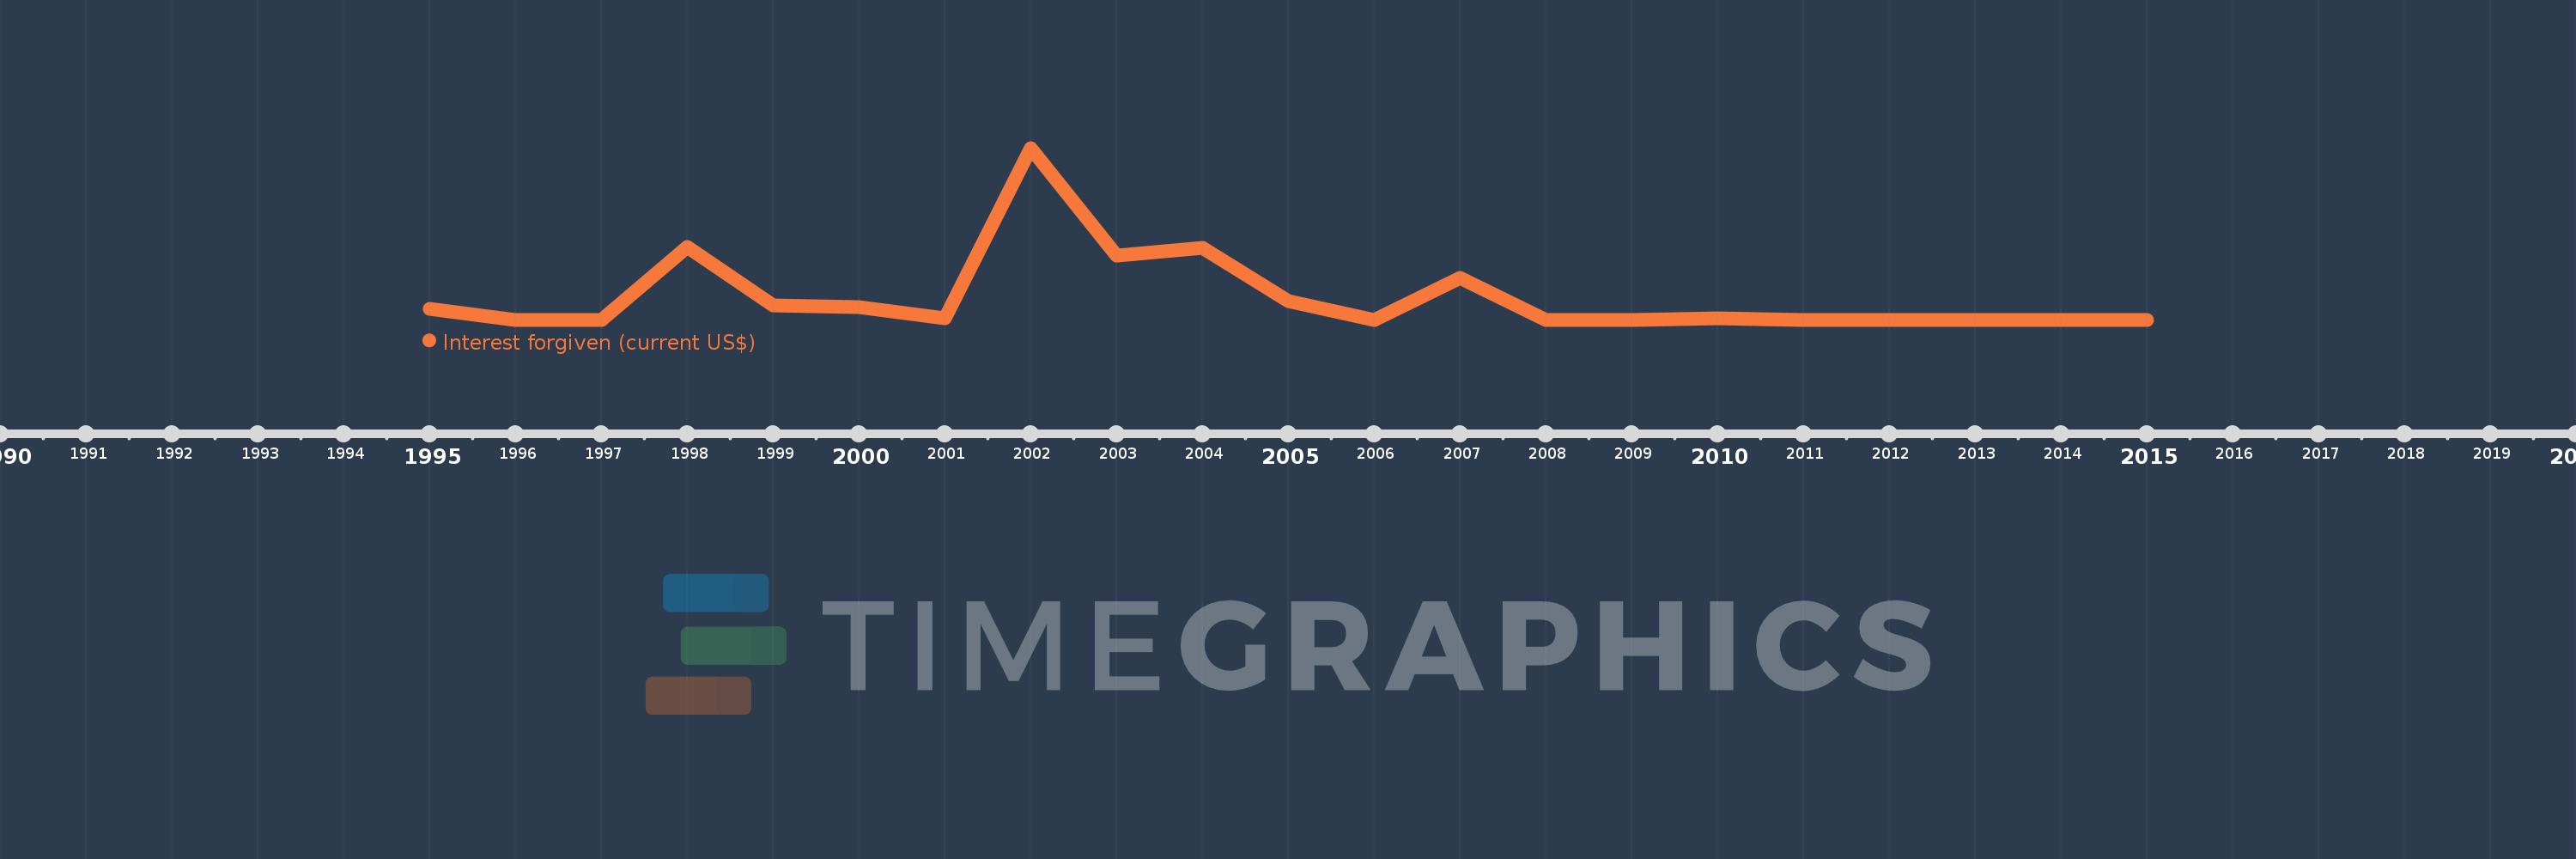
Interest forgiven (current US$)
2015,2014,2013,2011,2010,2009,2008,2007,2006,2005,2004,2003,2002,2001,2000,1999,1998,1997,1996,1995
Queste statistiche in altri paesi:
Linea del tempo:
Questa scala temporale mostra un grafico dal 1995 anno al 2015 anno. Cameroon. I dati fino ad 1994 anno non disponibili. Il numero di osservazioni attuali secondo i date: 20.
La fonte (nome):
Indicatori dello sviluppo mondiale
La fonte (organizzazione):
World Bank, International Debt Statistics.
Categorie:
External Debt
sono stati aggiornati
23 apr 2017 anni
Indicatori delle variazioni dei valori per anni
Minima:
0.0
1 gen 2008 anni
Massimo:
209.594 Mln
1 gen 2002 anni
Alla data di osservazione
Valore
Variazione assoluta
La variazione rispetto al valore precedente
1 gen 1995 anni
12.821 Mln
+12.821 Mln
0.0%
1 gen 1996 anni
5.0 Mille.
-12.816 Mln
-99.96%
1 gen 1997 anni
64.0 Mille.
+59.0 Mille.
1.18 Mille.%
1 gen 1998 anni
88.421 Mln
+88.357 Mln
138.06 Mille.%
1 gen 1999 anni
18.004 Mln
-70.417 Mln
-79.64%
1 gen 2000 anni
15.705 Mln
-2.299 Mln
-12.77%
1 gen 2001 anni
1.861 Mln
-13.844 Mln
-88.15%
1 gen 2002 anni
209.594 Mln
+207.733 Mln
11.16 Mille.%
1 gen 2003 anni
78.387 Mln
-131.207 Mln
-62.6%
1 gen 2004 anni
87.72 Mln
+9.333 Mln
11.91%
1 gen 2005 anni
22.554 Mln
-65.166 Mln
-74.29%
1 gen 2006 anni
40.0 Mille.
-22.514 Mln
-99.82%
1 gen 2007 anni
50.891 Mln
+50.851 Mln
127.13 Mille.%
1 gen 2008 anni
0.0
-50.891 Mln
-100.0%
1 gen 2010 anni
1.295 Mln
+1.295 Mln
%
1 gen 2011 anni
0.0
-1.295 Mln
-100.0%
1 gen 2013 anni
74.0 Mille.
+74.0 Mille.
%
1 gen 2014 anni
0.0
-74.0 Mille.
-100.0%
Classificazione dei paesi secondo i statistiche attuali per anni


Commenti: