29
/fr/
fr
AIzaSyAYiBZKx7MnpbEhh9jyipgxe19OcubqV5w
April 1, 2024
96599
Burundi
BDI
true
2
1
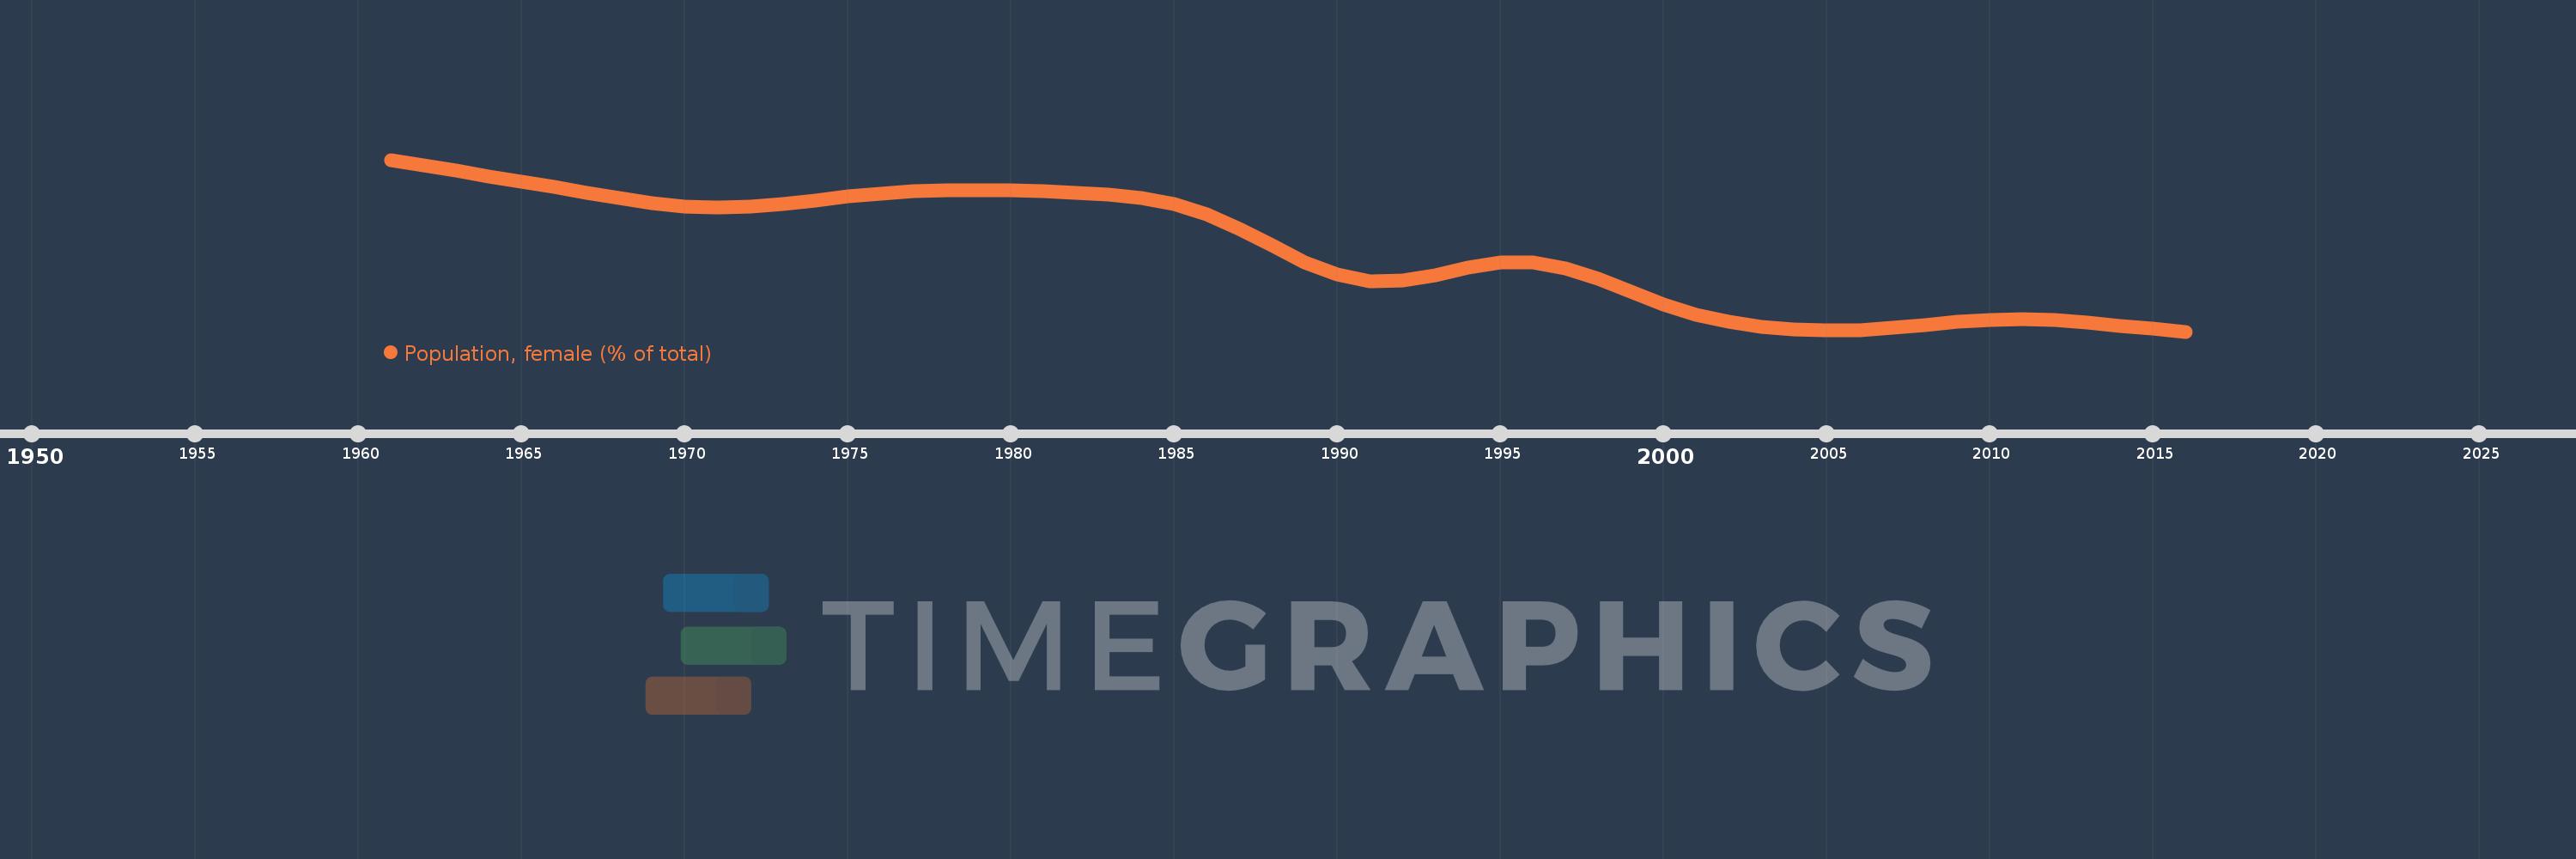
Population, female (% of total)
2016,2015,2014,2013,2012,2011,2010,2009,2008,2007,2006,2005,2004,2003,2002,2001,2000,1999,1998,1997,1996,1995,1994,1993,1992,1991,1990,1989,1988,1987,1986,1985,1984,1983,1982,1981,1980,1979,1978,1977,1976,1975,1974,1973,1972,1971,1970,1969,1968,1967,1966,1965,1964,1963,1962,1961
Cette statistique dans les autres pays:
AfghanistanAlbaniaAlgeriaAngolaAntigua and BarbudaArab WorldArgentinaArmeniaArubaAustraliaAustriaAzerbaijanBahamas, TheBahrainBangladeshBarbadosBelarusBelgiumBelizeBeninBhutanBoliviaBosnia and HerzegovinaBotswanaBrazilBrunei DarussalamBulgariaBurkina FasoBurundiCabo VerdeCambodiaCameroonCanadaCaribbean small statesCentral African RepublicCentral Europe and the BalticsChadChannel IslandsChileChinaColombiaComorosCongo, Dem. Rep.Congo, Rep.Costa RicaCote d'IvoireCroatiaCubaCuracaoCyprusCzech RepublicDenmarkDjiboutiDominican RepublicEarly-demographic dividendEast Asia & PacificEast Asia & Pacific (excluding high income)East Asia & Pacific (IDA & IBRD countries)EcuadorEgypt, Arab Rep.El SalvadorEquatorial GuineaEritreaEstoniaEthiopiaEuro areaEurope & Central AsiaEurope & Central Asia (excluding high income)Europe & Central Asia (IDA & IBRD countries)European UnionFijiFinlandFragile and conflict affected situationsFranceFrench PolynesiaGabonGambia, TheGeorgiaGermanyGhanaGreeceGrenadaGuamGuatemalaGuineaGuinea-BissauGuyanaHaitiHeavily indebted poor countries (HIPC)High incomeHondurasHong Kong SAR, ChinaHungaryIBRD onlyIcelandIDA & IBRD totalIDA blendIDA onlyIDA totalIndiaIndonesiaIran, Islamic Rep.IraqIrelandIsraelItalyJamaicaJapanJordanKazakhstanKenyaKiribatiKorea, Dem. People’s Rep.Korea, Rep.KosovoKuwaitKyrgyz RepublicLao PDRLate-demographic dividendLatin America & Caribbean Latin America & Caribbean (excluding high income)Latin America & the Caribbean (IDA & IBRD countries)LatviaLeast developed countries: UN classificationLebanonLesothoLiberiaLibyaLithuaniaLow & middle incomeLow incomeLower middle incomeLuxembourgMacao SAR, ChinaMacedonia, FYRMadagascarMalawiMalaysiaMaldivesMaliMaltaMauritaniaMauritiusMexicoMicronesia, Fed. Sts.Middle East & North AfricaMiddle East & North Africa (excluding high income)Middle East & North Africa (IDA & IBRD countries)Middle incomeMoldovaMongoliaMontenegroMoroccoMozambiqueMyanmarNamibiaNepalNetherlandsNew CaledoniaNew ZealandNicaraguaNigerNigeriaNorth AmericaNorwayOECD membersOmanOther small statesPacific island small statesPakistanPanamaPapua New GuineaParaguayPeruPhilippinesPolandPortugalPost-demographic dividendPre-demographic dividendPuerto RicoQatarRomaniaRussian FederationRwandaSamoaSao Tome and PrincipeSaudi ArabiaSenegalSerbiaSeychellesSierra LeoneSingaporeSlovak RepublicSloveniaSmall statesSolomon IslandsSomaliaSouth AfricaSouth AsiaSouth Asia (IDA & IBRD)South SudanSpainSri LankaSt. LuciaSt. Vincent and the GrenadinesSub-Saharan Africa Sub-Saharan Africa (excluding high income)Sub-Saharan Africa (IDA & IBRD countries)SudanSurinameSwazilandSwedenSwitzerlandSyrian Arab RepublicTajikistanTanzaniaThailandTimor-LesteTogoTongaTrinidad and TobagoTunisiaTurkeyTurkmenistanUgandaUkraineUnited Arab EmiratesUnited KingdomUnited StatesUpper middle incomeUruguayUzbekistanVanuatuVenezuela, RBVietnamVirgin Islands (U.S.)West Bank and GazaWorldYemen, Rep.ZambiaZimbabwe La ligne de temps
Cette échelle de temps montre un graphique de 1961 année à 2016 année Burundi. Les données jusqu'à 1960 année ne sont pas présentés. Quantité d'observations actuelles selon dates: 56.
Source (désignation):
Les indicateurs du développement mondiale
Source (organisation):
World Bank staff estimates based on male/female distributions of United Nations Population Division's World Population Prospects.
Catégories:
Health
Dernière mise à jour
23 avr. 2017
Les indicateurs de changement de valeurs selon les années
Minimum:
50.583
1 janv. 2016
Maximum:
51.728
1 janv. 1961
Pour la date d''observation
Valeur
Changement absolu
Le changement par rapport à la valeur précédente
1 janv. 1961
51.728
+51.728
0.0%
1 janv. 1962
51.691
-0.037
-0.07%
1 janv. 1963
51.655
-0.036
-0.07%
1 janv. 1964
51.619
-0.036
-0.07%
1 janv. 1965
51.583
-0.036
-0.07%
1 janv. 1966
51.546
-0.036
-0.07%
1 janv. 1967
51.509
-0.038
-0.07%
1 janv. 1968
51.471
-0.037
-0.07%
1 janv. 1969
51.439
-0.032
-0.06%
1 janv. 1970
51.418
-0.022
-0.04%
1 janv. 1971
51.41
-0.008
-0.02%
1 janv. 1972
51.416
+0.006
0.01%
1 janv. 1973
51.433
+0.017
0.03%
1 janv. 1974
51.457
+0.024
0.05%
1 janv. 1975
51.482
+0.025
0.05%
1 janv. 1976
51.503
+0.021
0.04%
1 janv. 1977
51.517
+0.014
0.03%
1 janv. 1978
51.525
+0.008
0.02%
1 janv. 1979
51.527
+0.002
0.0%
1 janv. 1980
51.524
-0.003
-0.01%
1 janv. 1981
51.517
-0.007
-0.01%
1 janv. 1982
51.508
-0.009
-0.02%
1 janv. 1983
51.496
-0.012
-0.02%
1 janv. 1984
51.473
-0.023
-0.04%
1 janv. 1985
51.431
-0.043
-0.08%
1 janv. 1986
51.364
-0.067
-0.13%
1 janv. 1987
51.269
-0.094
-0.18%
1 janv. 1988
51.156
-0.113
-0.22%
1 janv. 1989
51.045
-0.111
-0.22%
1 janv. 1990
50.961
-0.084
-0.16%
1 janv. 1991
50.918
-0.043
-0.08%
1 janv. 1992
50.921
+0.003
0.01%
1 janv. 1993
50.96
+0.038
0.07%
1 janv. 1994
51.01
+0.051
0.1%
1 janv. 1995
51.045
+0.034
0.07%
1 janv. 1996
51.044
0.0
0.0%
1 janv. 1997
51.004
-0.04
-0.08%
1 janv. 1998
50.934
-0.07
-0.14%
1 janv. 1999
50.847
-0.087
-0.17%
1 janv. 2000
50.763
-0.084
-0.17%
1 janv. 2001
50.696
-0.067
-0.13%
1 janv. 2002
50.648
-0.048
-0.09%
1 janv. 2003
50.616
-0.033
-0.06%
1 janv. 2004
50.597
-0.018
-0.04%
1 janv. 2005
50.591
-0.007
-0.01%
1 janv. 2006
50.593
+0.003
0.01%
1 janv. 2007
50.606
+0.012
0.02%
1 janv. 2008
50.626
+0.02
0.04%
1 janv. 2009
50.648
+0.022
0.04%
1 janv. 2010
50.663
+0.015
0.03%
1 janv. 2011
50.667
+0.004
0.01%
1 janv. 2012
50.66
-0.007
-0.01%
1 janv. 2013
50.643
-0.017
-0.03%
1 janv. 2014
50.622
-0.022
-0.04%
1 janv. 2015
50.601
-0.021
-0.04%
1 janv. 2016
50.583
-0.017
-0.03%
Classement des pays selon les statistiques actuelles par années


Commentaires: