29
/fr/
fr
AIzaSyAYiBZKx7MnpbEhh9jyipgxe19OcubqV5w
April 1, 2024
90530
Botswana
BWA
true
2
1
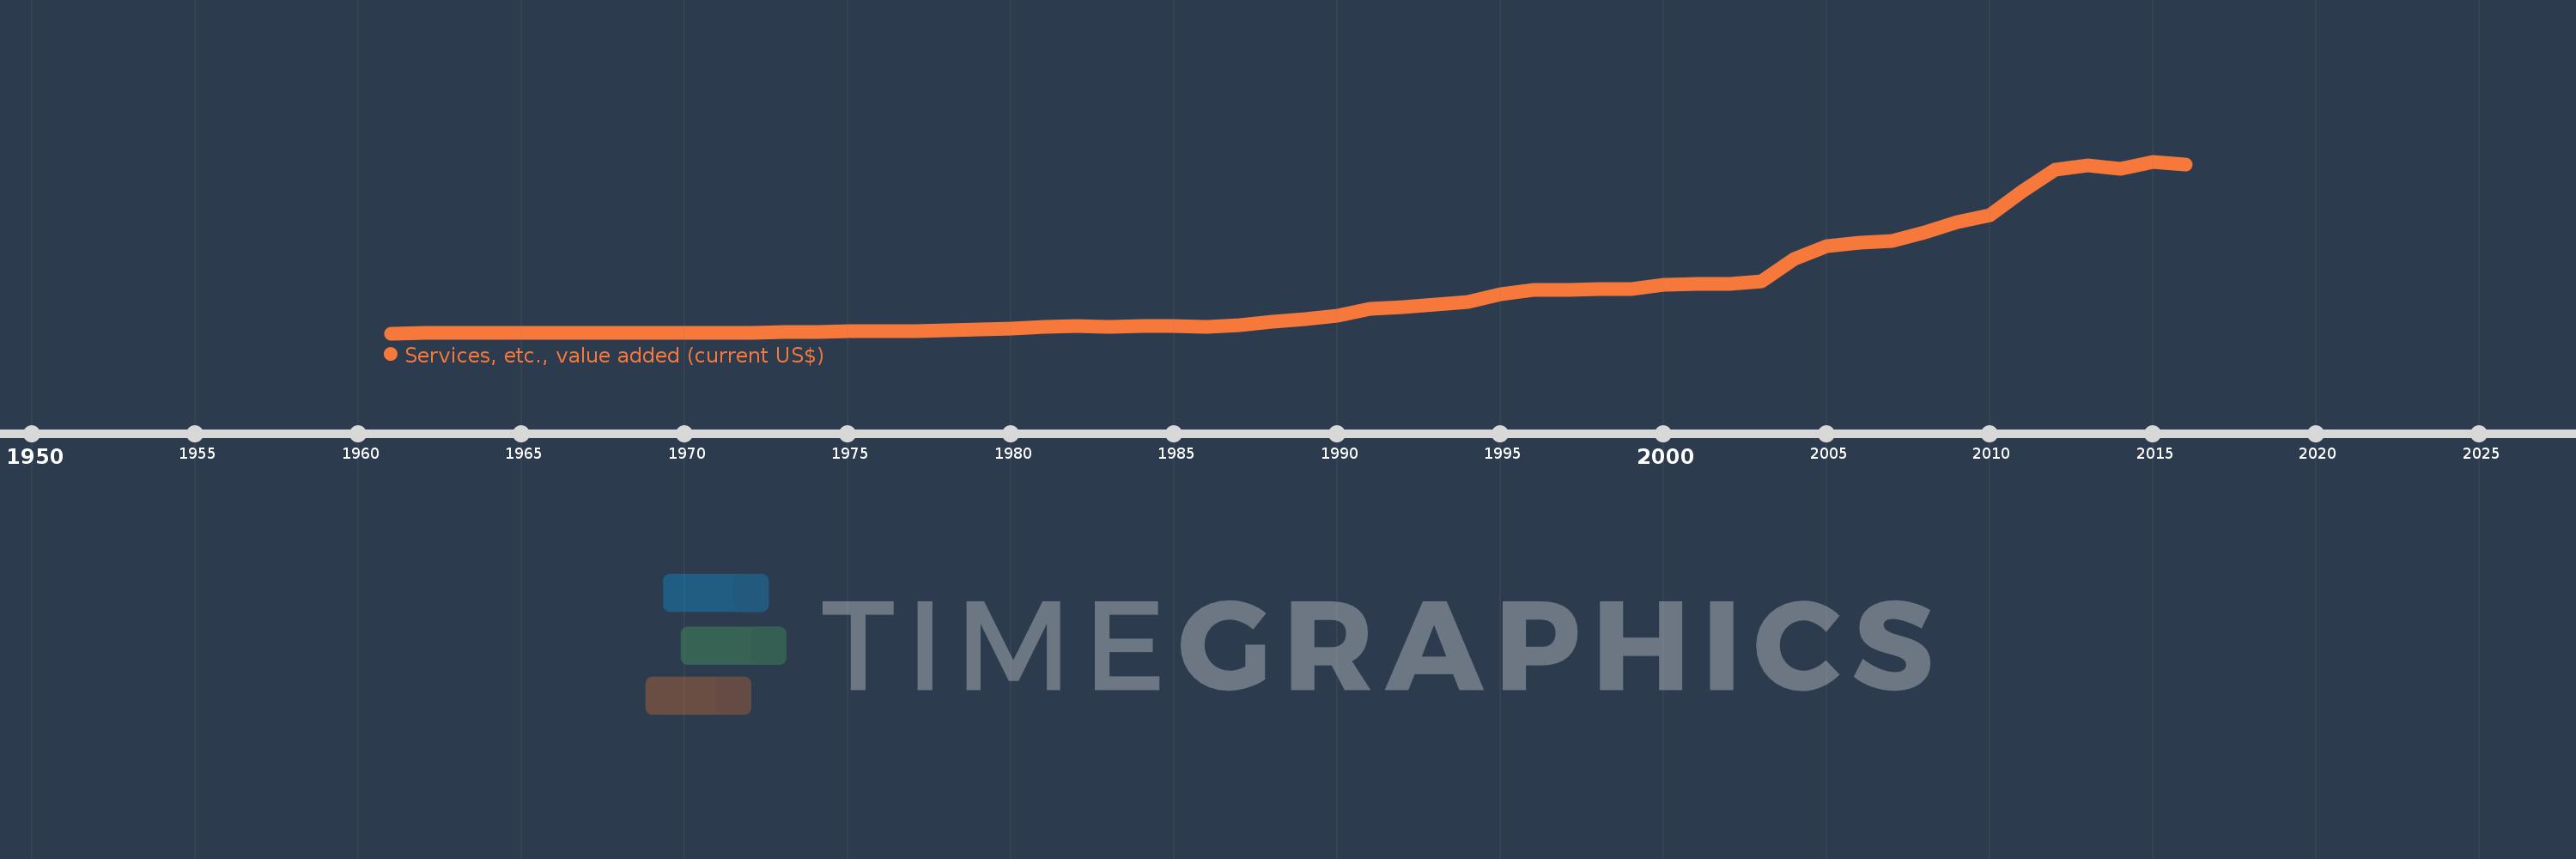
Services, etc., value added (current US$)
2016,2015,2014,2013,2012,2011,2010,2009,2008,2007,2006,2005,2004,2003,2002,2001,2000,1999,1998,1997,1996,1995,1994,1993,1992,1991,1990,1989,1988,1987,1986,1985,1984,1983,1982,1981,1980,1979,1978,1977,1976,1975,1974,1973,1972,1971,1970,1969,1968,1967,1966,1965,1964,1963,1962,1961
Cette statistique dans les autres pays:
AfghanistanAlbaniaAlgeriaAndorraAngolaAntigua and BarbudaArab WorldArgentinaArmeniaArubaAustraliaAustriaAzerbaijanBahamas, TheBahrainBangladeshBarbadosBelarusBelgiumBelizeBeninBermudaBhutanBoliviaBosnia and HerzegovinaBotswanaBrazilBrunei DarussalamBulgariaBurkina FasoBurundiCabo VerdeCambodiaCameroonCanadaCaribbean small statesCentral African RepublicCentral Europe and the BalticsChadChileChinaColombiaComorosCongo, Dem. Rep.Congo, Rep.Costa RicaCote d'IvoireCroatiaCubaCyprusCzech RepublicDenmarkDjiboutiDominicaDominican RepublicEarly-demographic dividendEast Asia & PacificEast Asia & Pacific (excluding high income)East Asia & Pacific (IDA & IBRD countries)EcuadorEgypt, Arab Rep.El SalvadorEquatorial GuineaEritreaEstoniaEthiopiaEuro areaEurope & Central AsiaEurope & Central Asia (excluding high income)Europe & Central Asia (IDA & IBRD countries)European UnionFaroe IslandsFijiFinlandFragile and conflict affected situationsFranceGabonGambia, TheGeorgiaGermanyGhanaGreeceGrenadaGuatemalaGuineaGuinea-BissauGuyanaHeavily indebted poor countries (HIPC)High incomeHondurasHong Kong SAR, ChinaHungaryIBRD onlyIcelandIDA & IBRD totalIDA blendIDA onlyIDA totalIndiaIndonesiaIran, Islamic Rep.IraqIrelandItalyJamaicaJapanJordanKazakhstanKenyaKiribatiKorea, Rep.KosovoKuwaitKyrgyz RepublicLao PDRLate-demographic dividendLatin America & Caribbean Latin America & Caribbean (excluding high income)Latin America & the Caribbean (IDA & IBRD countries)LatviaLeast developed countries: UN classificationLebanonLesothoLiberiaLibyaLithuaniaLow & middle incomeLow incomeLower middle incomeLuxembourgMacao SAR, ChinaMacedonia, FYRMadagascarMalawiMalaysiaMaldivesMaliMaltaMarshall IslandsMauritaniaMauritiusMexicoMicronesia, Fed. Sts.Middle East & North AfricaMiddle East & North Africa (excluding high income)Middle East & North Africa (IDA & IBRD countries)Middle incomeMoldovaMongoliaMontenegroMoroccoMozambiqueMyanmarNamibiaNepalNetherlandsNew CaledoniaNew ZealandNicaraguaNigerNigeriaNorth AmericaNorwayOECD membersOmanOther small statesPacific island small statesPakistanPalauPanamaPapua New GuineaParaguayPeruPhilippinesPolandPortugalPost-demographic dividendPre-demographic dividendPuerto RicoQatarRomaniaRussian FederationRwandaSamoaSao Tome and PrincipeSaudi ArabiaSenegalSerbiaSeychellesSierra LeoneSingaporeSlovak RepublicSloveniaSmall statesSolomon IslandsSouth AfricaSouth AsiaSouth Asia (IDA & IBRD)SpainSri LankaSt. Kitts and NevisSt. LuciaSt. Vincent and the GrenadinesSub-Saharan Africa Sub-Saharan Africa (excluding high income)Sub-Saharan Africa (IDA & IBRD countries)SudanSurinameSwazilandSwedenSwitzerlandSyrian Arab RepublicTajikistanTanzaniaThailandTimor-LesteTogoTongaTrinidad and TobagoTunisiaTurkeyTurkmenistanTuvaluUgandaUkraineUnited Arab EmiratesUnited KingdomUnited StatesUpper middle incomeUruguayUzbekistanVanuatuVenezuela, RBVietnamWest Bank and GazaWorldYemen, Rep.ZambiaZimbabwe La ligne de temps
Cette échelle de temps montre un graphique de 1961 année à 2016 année Botswana. Les données jusqu'à 1960 année ne sont pas présentés. Quantité d'observations actuelles selon dates: 56.
Source (désignation):
Les indicateurs du développement mondiale
Source (organisation):
World Bank national accounts data, and OECD National Accounts data files.
Catégories:
Economy & Growth
Dernière mise à jour
23 avr. 2017
Les indicateurs de changement de valeurs selon les années
Minimum:
13.113 mln.
1 janv. 1961
Maximum:
8.486 mds
1 janv. 2015
Pour la date d''observation
Valeur
Changement absolu
Le changement par rapport à la valeur précédente
1 janv. 1961
13.113 mln.
+13.113 mln.
0.0%
1 janv. 1962
15.105 mln.
+1.992 mln.
15.19%
1 janv. 1963
17.285 mln.
+2.18 mln.
14.43%
1 janv. 1964
19.251 mln.
+1.966 mln.
11.38%
1 janv. 1965
20.102 mln.
+850.805 milles
4.42%
1 janv. 1966
21.498 mln.
+1.397 mln.
6.95%
1 janv. 1967
23.85 mln.
+2.352 mln.
10.94%
1 janv. 1968
25.66 mln.
+1.81 mln.
7.59%
1 janv. 1969
29.08 mln.
+3.42 mln.
13.33%
1 janv. 1970
32.309 mln.
+3.23 mln.
11.11%
1 janv. 1971
37.967 mln.
+5.657 mln.
17.51%
1 janv. 1972
50.055 mln.
+12.088 mln.
31.84%
1 janv. 1973
65.074 mln.
+15.019 mln.
30.01%
1 janv. 1974
97.75 mln.
+32.676 mln.
50.21%
1 janv. 1975
123.404 mln.
+25.653 mln.
26.24%
1 janv. 1976
119.471 mln.
-3.932 mln.
-3.19%
1 janv. 1977
131.905 mln.
+12.434 mln.
10.41%
1 janv. 1978
161.29 mln.
+29.385 mln.
22.28%
1 janv. 1979
198.755 mln.
+37.464 mln.
23.23%
1 janv. 1980
250.55 mln.
+51.796 mln.
26.06%
1 janv. 1981
317.283 mln.
+66.733 mln.
26.63%
1 janv. 1982
357.818 mln.
+40.535 mln.
12.78%
1 janv. 1983
349.533 mln.
-8.285 mln.
-2.32%
1 janv. 1984
383.937 mln.
+34.404 mln.
9.84%
1 janv. 1985
391.451 mln.
+7.515 mln.
1.96%
1 janv. 1986
335.021 mln.
-56.43 mln.
-14.42%
1 janv. 1987
413.965 mln.
+78.944 mln.
23.56%
1 janv. 1988
568.871 mln.
+154.906 mln.
37.42%
1 janv. 1989
712.38 mln.
+143.51 mln.
25.23%
1 janv. 1990
877.345 mln.
+164.965 mln.
23.16%
1 janv. 1991
1.206 mds
+329.073 mln.
37.51%
1 janv. 1992
1.298 mds
+91.998 mln.
7.63%
1 janv. 1993
1.439 mds
+140.972 mln.
10.86%
1 janv. 1994
1.575 mds
+135.495 mln.
9.41%
1 janv. 1995
1.92 mds
+344.732 mln.
21.89%
1 janv. 1996
2.173 mds
+253.027 mln.
13.18%
1 janv. 1997
2.151 mds
-21.298 mln.
-0.98%
1 janv. 1998
2.195 mds
+43.325 mln.
2.01%
1 janv. 1999
2.192 mds
-2.947 mln.
-0.13%
1 janv. 2000
2.419 mds
+227.272 mln.
10.37%
1 janv. 2001
2.462 mds
+43.332 mln.
1.79%
1 janv. 2002
2.464 mds
+2.081 mln.
0.08%
1 janv. 2003
2.566 mds
+101.982 mln.
4.14%
1 janv. 2004
3.698 mds
+1.132 mds
44.1%
1 janv. 2005
4.295 mds
+597.384 mln.
16.15%
1 janv. 2006
4.497 mds
+201.7 mln.
4.7%
1 janv. 2007
4.577 mds
+80.106 mln.
1.78%
1 janv. 2008
5.007 mds
+429.733 mln.
9.39%
1 janv. 2009
5.48 mds
+473.46 mln.
9.46%
1 janv. 2010
5.836 mds
+355.958 mln.
6.5%
1 janv. 2011
7.034 mds
+1.197 mds
20.52%
1 janv. 2012
8.094 mds
+1.06 mds
15.07%
1 janv. 2013
8.316 mds
+222.669 mln.
2.75%
1 janv. 2014
8.132 mds
-184.699 mln.
-2.22%
1 janv. 2015
8.486 mds
+354.485 mln.
4.36%
1 janv. 2016
8.341 mds
-145.561 mln.
-1.72%
Classement des pays selon les statistiques actuelles par années


Commentaires: