29
/fr/
fr
AIzaSyAYiBZKx7MnpbEhh9jyipgxe19OcubqV5w
April 1, 2024
82855
Belize
BLZ
true
2
1
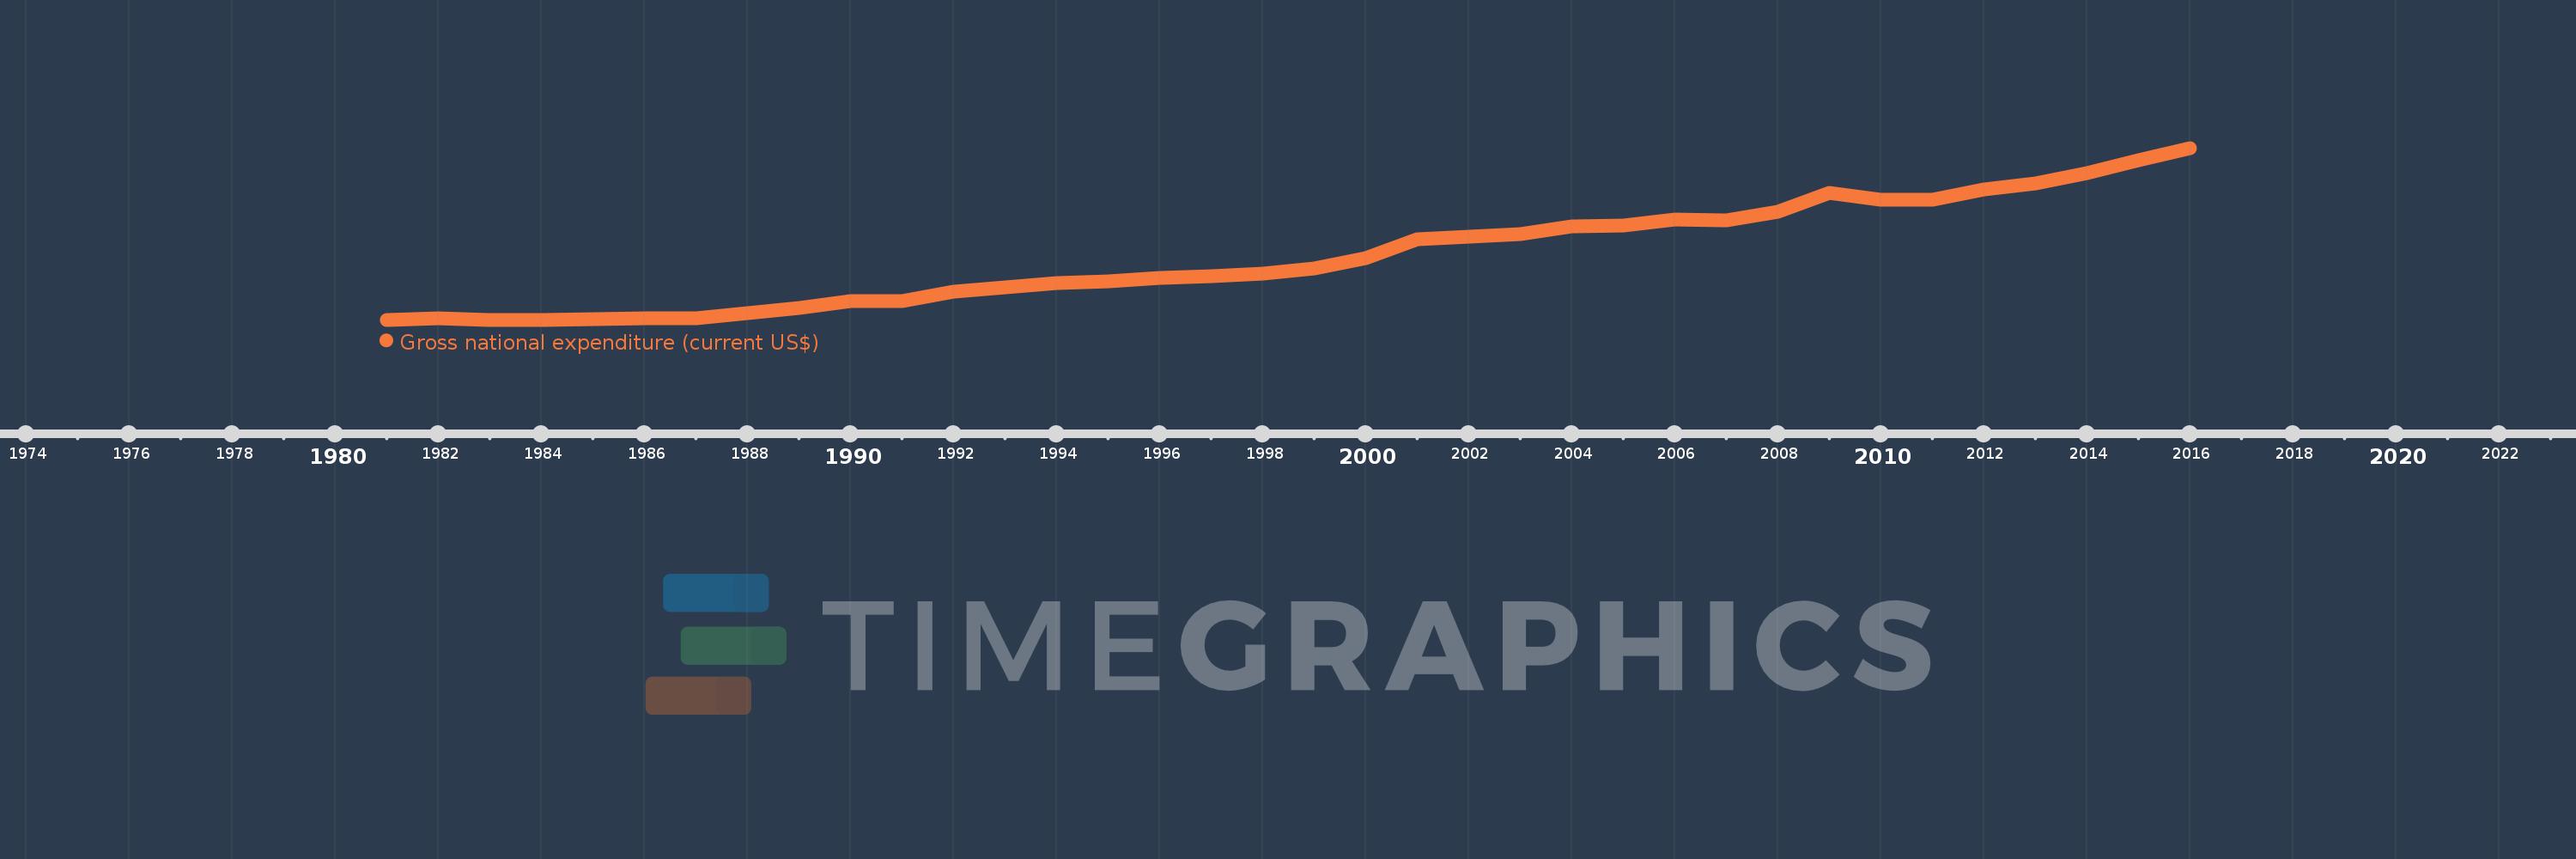
Gross national expenditure (current US$)
2016,2015,2014,2013,2012,2011,2010,2009,2008,2007,2006,2005,2004,2003,2002,2001,2000,1999,1998,1997,1996,1995,1994,1993,1992,1991,1990,1989,1988,1987,1986,1985,1984,1983,1982,1981
Cette statistique dans les autres pays:
AfghanistanAlbaniaAlgeriaAngolaAntigua and BarbudaArab WorldArgentinaArmeniaArubaAustraliaAustriaAzerbaijanBahamas, TheBahrainBangladeshBarbadosBelarusBelgiumBelizeBeninBermudaBhutanBoliviaBosnia and HerzegovinaBotswanaBrazilBrunei DarussalamBulgariaBurkina FasoBurundiCabo VerdeCambodiaCameroonCanadaCaribbean small statesCentral African RepublicCentral Europe and the BalticsChadChileChinaColombiaComorosCongo, Dem. Rep.Congo, Rep.Costa RicaCote d'IvoireCroatiaCubaCyprusCzech RepublicDenmarkDjiboutiDominicaDominican RepublicEarly-demographic dividendEast Asia & PacificEast Asia & Pacific (excluding high income)East Asia & Pacific (IDA & IBRD countries)EcuadorEgypt, Arab Rep.El SalvadorEquatorial GuineaEritreaEstoniaEthiopiaEuro areaEurope & Central AsiaEurope & Central Asia (excluding high income)Europe & Central Asia (IDA & IBRD countries)European UnionFaroe IslandsFijiFinlandFragile and conflict affected situationsFranceFrench PolynesiaGabonGambia, TheGeorgiaGermanyGhanaGreeceGrenadaGuatemalaGuineaGuinea-BissauGuyanaHaitiHeavily indebted poor countries (HIPC)High incomeHondurasHong Kong SAR, ChinaHungaryIBRD onlyIcelandIDA & IBRD totalIDA blendIDA onlyIDA totalIndiaIndonesiaIran, Islamic Rep.IraqIrelandIsraelItalyJamaicaJapanJordanKazakhstanKenyaKiribatiKorea, Rep.KosovoKuwaitKyrgyz RepublicLao PDRLate-demographic dividendLatin America & Caribbean Latin America & Caribbean (excluding high income)Latin America & the Caribbean (IDA & IBRD countries)LatviaLeast developed countries: UN classificationLebanonLesothoLiberiaLibyaLithuaniaLow & middle incomeLow incomeLower middle incomeLuxembourgMacao SAR, ChinaMacedonia, FYRMadagascarMalawiMalaysiaMaldivesMaliMaltaMauritaniaMauritiusMexicoMicronesia, Fed. Sts.Middle East & North AfricaMiddle East & North Africa (excluding high income)Middle East & North Africa (IDA & IBRD countries)Middle incomeMoldovaMongoliaMontenegroMoroccoMozambiqueMyanmarNamibiaNepalNetherlandsNew CaledoniaNew ZealandNicaraguaNigerNigeriaNorth AmericaNorwayOECD membersOmanOther small statesPacific island small statesPakistanPalauPanamaPapua New GuineaParaguayPeruPhilippinesPolandPortugalPost-demographic dividendPre-demographic dividendPuerto RicoQatarRomaniaRussian FederationRwandaSamoaSaudi ArabiaSenegalSerbiaSeychellesSierra LeoneSingaporeSlovak RepublicSloveniaSmall statesSolomon IslandsSomaliaSouth AfricaSouth AsiaSouth Asia (IDA & IBRD)South SudanSpainSri LankaSt. Kitts and NevisSt. LuciaSt. Vincent and the GrenadinesSub-Saharan Africa Sub-Saharan Africa (excluding high income)Sub-Saharan Africa (IDA & IBRD countries)SudanSurinameSwazilandSwedenSwitzerlandSyrian Arab RepublicTajikistanTanzaniaThailandTimor-LesteTogoTongaTrinidad and TobagoTunisiaTurkeyTurkmenistanUgandaUkraineUnited Arab EmiratesUnited KingdomUnited StatesUpper middle incomeUruguayUzbekistanVanuatuVenezuela, RBVietnamWest Bank and GazaWorldYemen, Rep.ZambiaZimbabwe La ligne de temps
Cette échelle de temps montre un graphique de 1981 année à 2016 année Belize. Les données jusqu'à 1980 année ne sont pas présentés. Quantité d'observations actuelles selon dates: 36.
Source (désignation):
Les indicateurs du développement mondiale
Source (organisation):
World Bank national accounts data, and OECD National Accounts data files.
Catégories:
Economy & Growth
Dernière mise à jour
23 avr. 2017
Les indicateurs de changement de valeurs selon les années
Minimum:
219.1 mln.
1 janv. 1984
Maximum:
1.899 mds
1 janv. 2016
Pour la date d''observation
Valeur
Changement absolu
Le changement par rapport à la valeur précédente
1 janv. 1981
220.45 mln.
+220.45 mln.
0.0%
1 janv. 1982
235.25 mln.
+14.8 mln.
6.71%
1 janv. 1983
219.75 mln.
-15.5 mln.
-6.59%
1 janv. 1984
219.1 mln.
-650.0 milles
-0.3%
1 janv. 1985
227.15 mln.
+8.05 mln.
3.67%
1 janv. 1986
235.95 mln.
+8.8 mln.
3.87%
1 janv. 1987
233.8 mln.
-2.15 mln.
-0.91%
1 janv. 1988
282.45 mln.
+48.65 mln.
20.81%
1 janv. 1989
333.25 mln.
+50.8 mln.
17.99%
1 janv. 1990
397.25 mln.
+64.0 mln.
19.2%
1 janv. 1991
404.15 mln.
+6.9 mln.
1.74%
1 janv. 1992
491.771 mln.
+87.621 mln.
21.68%
1 janv. 1993
534.822 mln.
+43.051 mln.
8.75%
1 janv. 1994
579.418 mln.
+44.596 mln.
8.34%
1 janv. 1995
596.003 mln.
+16.585 mln.
2.86%
1 janv. 1996
627.272 mln.
+31.269 mln.
5.25%
1 janv. 1997
643.067 mln.
+15.795 mln.
2.52%
1 janv. 1998
673.472 mln.
+30.405 mln.
4.73%
1 janv. 1999
718.938 mln.
+45.466 mln.
6.75%
1 janv. 2000
822.838 mln.
+103.901 mln.
14.45%
1 janv. 2001
1.004 mds
+181.484 mln.
22.06%
1 janv. 2002
1.031 mds
+26.488 mln.
2.64%
1 janv. 2003
1.059 mds
+28.291 mln.
2.74%
1 janv. 2004
1.129 mds
+69.765 mln.
6.59%
1 janv. 2005
1.142 mds
+13.066 mln.
1.16%
1 janv. 2006
1.202 mds
+60.294 mln.
5.28%
1 janv. 2007
1.192 mds
-10.692 mln.
-0.89%
1 janv. 2008
1.277 mds
+85.561 mln.
7.18%
1 janv. 2009
1.461 mds
+183.756 mln.
14.39%
1 janv. 2010
1.392 mds
-68.55 mln.
-4.69%
1 janv. 2011
1.392 mds
-565.07 milles
-0.04%
1 janv. 2012
1.49 mds
+98.58 mln.
7.08%
1 janv. 2013
1.55 mds
+60.098 mln.
4.03%
1 janv. 2014
1.655 mds
+104.897 mln.
6.77%
1 janv. 2015
1.782 mds
+126.514 mln.
7.64%
1 janv. 2016
1.899 mds
+116.986 mln.
6.57%
Classement des pays selon les statistiques actuelles par années


Commentaires: