29
/fr/
fr
AIzaSyAYiBZKx7MnpbEhh9jyipgxe19OcubqV5w
April 1, 2024
82742
Belize
BLZ
true
2
1
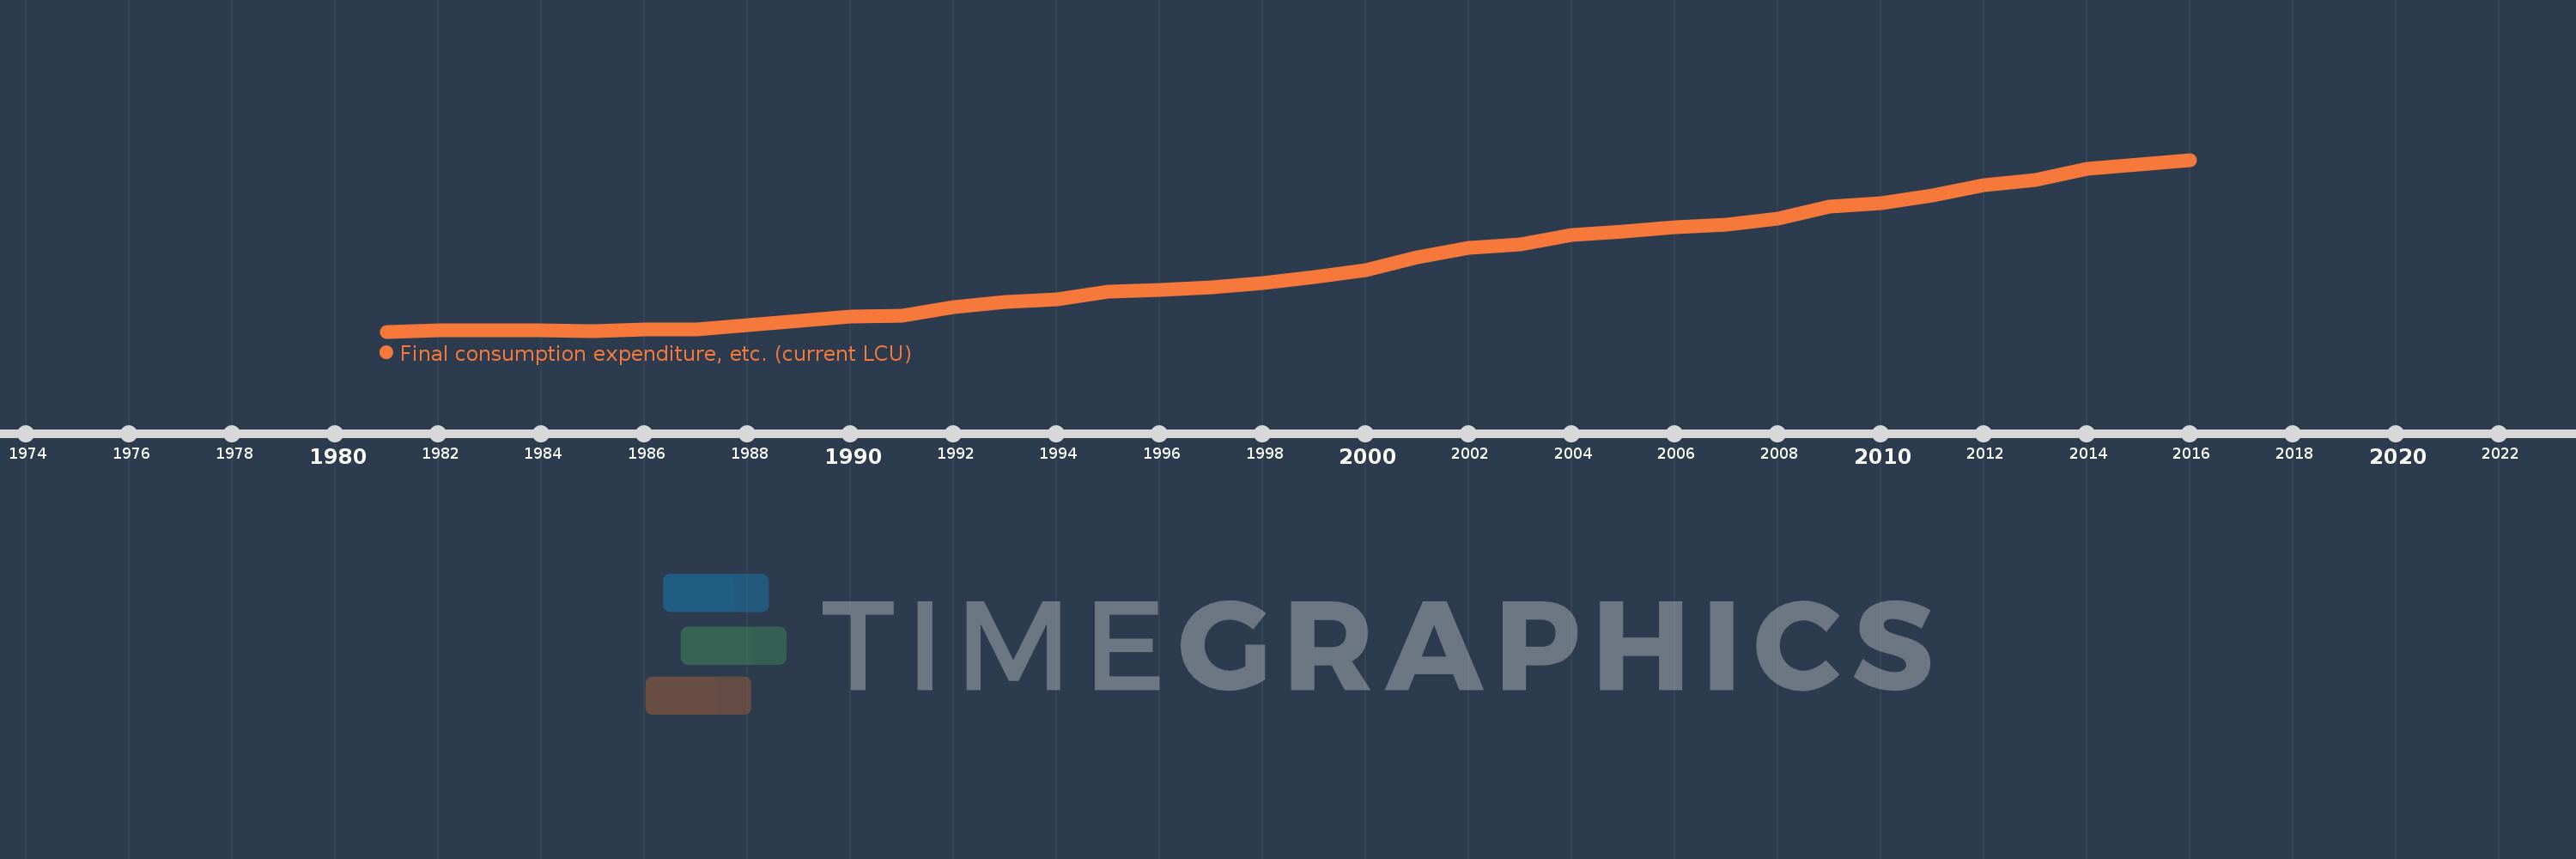
Final consumption expenditure, etc. (current LCU)
2016,2015,2014,2013,2012,2011,2010,2009,2008,2007,2006,2005,2004,2003,2002,2001,2000,1999,1998,1997,1996,1995,1994,1993,1992,1991,1990,1989,1988,1987,1986,1985,1984,1983,1982,1981
Cette statistique dans les autres pays:
AfghanistanAlbaniaAlgeriaAngolaAntigua and BarbudaArgentinaArmeniaArubaAustraliaAustriaAzerbaijanBahamas, TheBahrainBangladeshBarbadosBelarusBelgiumBelizeBeninBermudaBhutanBoliviaBosnia and HerzegovinaBotswanaBrazilBrunei DarussalamBulgariaBurkina FasoBurundiCabo VerdeCambodiaCameroonCanadaCentral African RepublicChadChileChinaColombiaComorosCongo, Dem. Rep.Congo, Rep.Costa RicaCote d'IvoireCroatiaCubaCyprusCzech RepublicDenmarkDjiboutiDominicaDominican RepublicEcuadorEgypt, Arab Rep.El SalvadorEquatorial GuineaEritreaEstoniaEthiopiaFaroe IslandsFijiFinlandFranceGabonGambia, TheGeorgiaGermanyGhanaGreeceGrenadaGuatemalaGuineaGuinea-BissauGuyanaHaitiHondurasHong Kong SAR, ChinaHungaryIcelandIndiaIndonesiaIran, Islamic Rep.IraqIrelandIsraelItalyJamaicaJapanJordanKazakhstanKenyaKiribatiKorea, Rep.KosovoKuwaitKyrgyz RepublicLao PDRLatviaLebanonLesothoLiberiaLibyaLithuaniaLuxembourgMacao SAR, ChinaMacedonia, FYRMadagascarMalawiMalaysiaMaldivesMaliMaltaMauritaniaMauritiusMexicoMicronesia, Fed. Sts.MoldovaMongoliaMontenegroMoroccoMozambiqueNamibiaNepalNetherlandsNew CaledoniaNew ZealandNicaraguaNigerNigeriaNorwayOmanPakistanPanamaPapua New GuineaParaguayPeruPhilippinesPolandPortugalPuerto RicoQatarRomaniaRussian FederationRwandaSaudi ArabiaSenegalSerbiaSeychellesSierra LeoneSingaporeSlovak RepublicSloveniaSolomon IslandsSomaliaSouth AfricaSouth SudanSpainSri LankaSt. Kitts and NevisSt. LuciaSt. Vincent and the GrenadinesSudanSurinameSwazilandSwedenSwitzerlandSyrian Arab RepublicTajikistanTanzaniaThailandTimor-LesteTogoTongaTrinidad and TobagoTunisiaTurkeyTurkmenistanUgandaUkraineUnited Arab EmiratesUnited KingdomUnited StatesUruguayUzbekistanVanuatuVenezuela, RBVietnamWest Bank and GazaYemen, Rep.ZambiaZimbabwe La ligne de temps
Cette échelle de temps montre un graphique de 1981 année à 2016 année Belize. Les données jusqu'à 1980 année ne sont pas présentés. Quantité d'observations actuelles selon dates: 36.
Source (désignation):
Les indicateurs du développement mondiale
Source (organisation):
World Bank national accounts data, and OECD National Accounts data files.
Catégories:
Economy & Growth
Dernière mise à jour
23 avr. 2017
Les indicateurs de changement de valeurs selon les années
Minimum:
347.0 mln.
1 janv. 1981
Maximum:
2.973 mds
1 janv. 2016
Pour la date d''observation
Valeur
Changement absolu
Le changement par rapport à la valeur précédente
1 janv. 1981
347.0 mln.
+347.0 mln.
0.0%
1 janv. 1982
370.0 mln.
+23.0 mln.
6.63%
1 janv. 1983
365.1 mln.
-4.9 mln.
-1.32%
1 janv. 1984
361.8 mln.
-3.3 mln.
-0.9%
1 janv. 1985
355.0 mln.
-6.8 mln.
-1.88%
1 janv. 1986
381.5 mln.
+26.5 mln.
7.46%
1 janv. 1987
374.8 mln.
-6.7 mln.
-1.76%
1 janv. 1988
443.6 mln.
+68.8 mln.
18.36%
1 janv. 1989
506.7 mln.
+63.1 mln.
14.22%
1 janv. 1990
574.5 mln.
+67.8 mln.
13.38%
1 janv. 1991
596.4 mln.
+21.9 mln.
3.81%
1 janv. 1992
720.542 mln.
+124.141 mln.
20.82%
1 janv. 1993
793.643 mln.
+73.102 mln.
10.15%
1 janv. 1994
839.935 mln.
+46.292 mln.
5.83%
1 janv. 1995
953.248 mln.
+113.313 mln.
13.49%
1 janv. 1996
985.312 mln.
+32.065 mln.
3.36%
1 janv. 1997
1.025 mds
+39.75 mln.
4.03%
1 janv. 1998
1.083 mds
+57.922 mln.
5.65%
1 janv. 1999
1.175 mds
+92.116 mln.
8.51%
1 janv. 2000
1.285 mds
+110.27 mln.
9.38%
1 janv. 2001
1.481 mds
+195.591 mln.
15.22%
1 janv. 2002
1.629 mds
+148.447 mln.
10.02%
1 janv. 2003
1.674 mds
+44.298 mln.
2.72%
1 janv. 2004
1.827 mds
+153.692 mln.
9.18%
1 janv. 2005
1.87 mds
+42.876 mln.
2.35%
1 janv. 2006
1.941 mds
+71.004 mln.
3.8%
1 janv. 2007
1.977 mds
+36.089 mln.
1.86%
1 janv. 2008
2.078 mds
+100.801 mln.
5.1%
1 janv. 2009
2.251 mds
+172.951 mln.
8.32%
1 janv. 2010
2.308 mds
+56.444 mln.
2.51%
1 janv. 2011
2.423 mds
+115.428 mln.
5.0%
1 janv. 2012
2.584 mds
+160.664 mln.
6.63%
1 janv. 2013
2.66 mds
+75.915 mln.
2.94%
1 janv. 2014
2.84 mds
+179.934 mln.
6.77%
1 janv. 2015
2.905 mds
+65.468 mln.
2.31%
1 janv. 2016
2.973 mds
+68.035 mln.
2.34%
Classement des pays selon les statistiques actuelles par années


Commentaires: