29
/fr/
fr
AIzaSyAYiBZKx7MnpbEhh9jyipgxe19OcubqV5w
April 1, 2024
75311
Azerbaijan
AZE
true
2
1
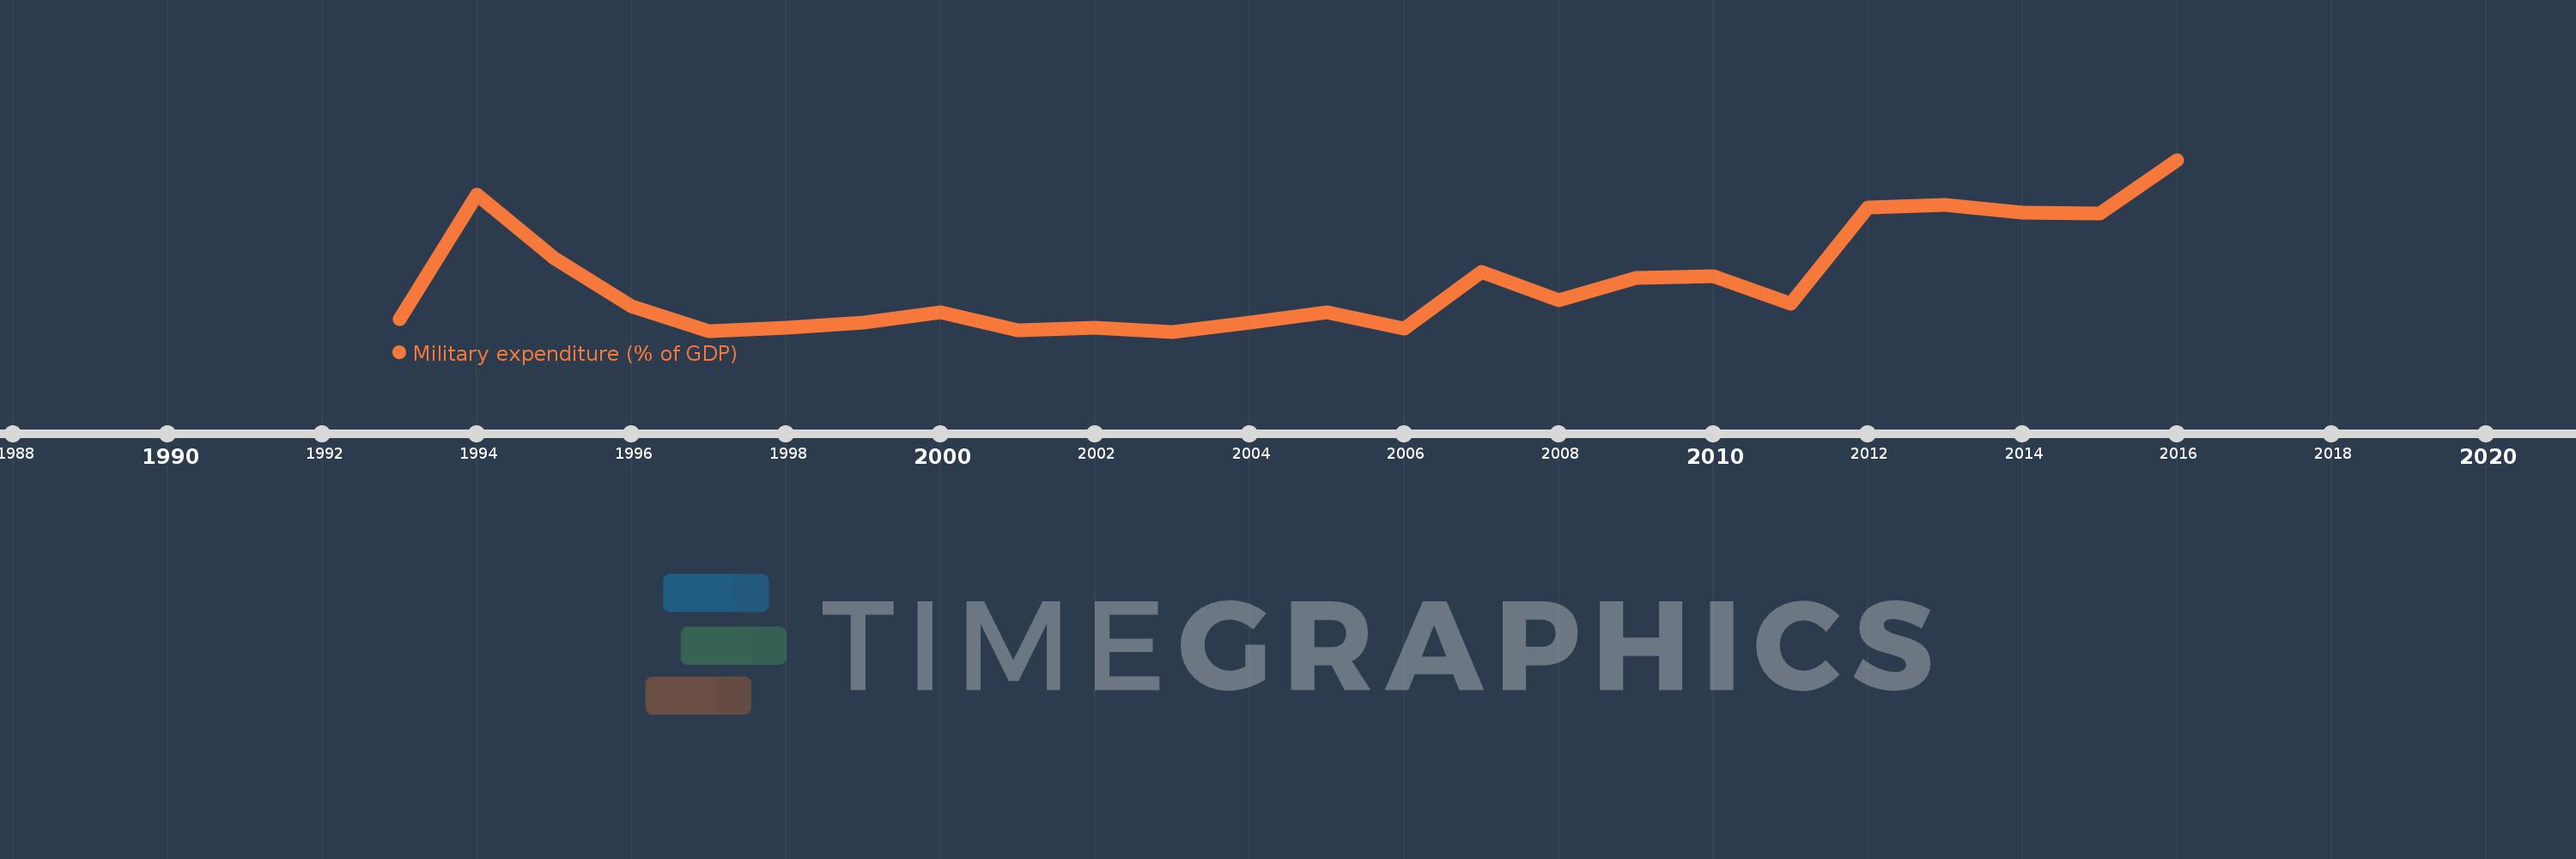
Military expenditure (% of GDP)
2016,2015,2014,2013,2012,2011,2010,2009,2008,2007,2006,2005,2004,2003,2002,2001,2000,1999,1998,1997,1996,1995,1994,1993
Cette statistique dans les autres pays:
La ligne de temps
Cette échelle de temps montre un graphique de 1993 année à 2016 année Azerbaijan. Les données jusqu'à 1992 année ne sont pas présentés. Quantité d'observations actuelles selon dates: 24.
Source (désignation):
Les indicateurs du développement mondiale
Source (organisation):
Stockholm International Peace Research Institute (SIPRI), Yearbook: Armaments, Disarmament and International Security.
Catégories:
Public Sector
Dernière mise à jour
23 avr. 2017
Les indicateurs de changement de valeurs selon les années
Minimum:
2.243
1 janv. 2003
Maximum:
5.612
1 janv. 2016
Pour la date d''observation
Valeur
Changement absolu
Le changement par rapport à la valeur précédente
1 janv. 1993
2.49
+2.49
0.0%
1 janv. 1994
4.934
+2.444
98.18%
1 janv. 1995
3.683
-1.251
-25.35%
1 janv. 1996
2.737
-0.946
-25.69%
1 janv. 1997
2.254
-0.483
-17.64%
1 janv. 1998
2.324
+0.07
3.1%
1 janv. 1999
2.412
+0.088
3.8%
1 janv. 2000
2.625
+0.213
8.82%
1 janv. 2001
2.268
-0.357
-13.61%
1 janv. 2002
2.312
+0.044
1.95%
1 janv. 2003
2.243
-0.069
-2.97%
1 janv. 2004
2.426
+0.183
8.16%
1 janv. 2005
2.629
+0.203
8.37%
1 janv. 2006
2.299
-0.33
-12.56%
1 janv. 2007
3.418
+1.119
48.66%
1 janv. 2008
2.864
-0.554
-16.2%
1 janv. 2009
3.291
+0.427
14.91%
1 janv. 2010
3.325
+0.034
1.04%
1 janv. 2011
2.791
-0.534
-16.07%
1 janv. 2012
4.67
+1.879
67.33%
1 janv. 2013
4.723
+0.053
1.14%
1 janv. 2014
4.578
-0.145
-3.07%
1 janv. 2015
4.558
-0.02
-0.45%
1 janv. 2016
5.612
+1.054
23.12%
Classement des pays selon les statistiques actuelles par années


Commentaires: