29
/fr/
fr
AIzaSyAYiBZKx7MnpbEhh9jyipgxe19OcubqV5w
April 1, 2024
69128
Antigua and Barbuda
ATG
true
2
1
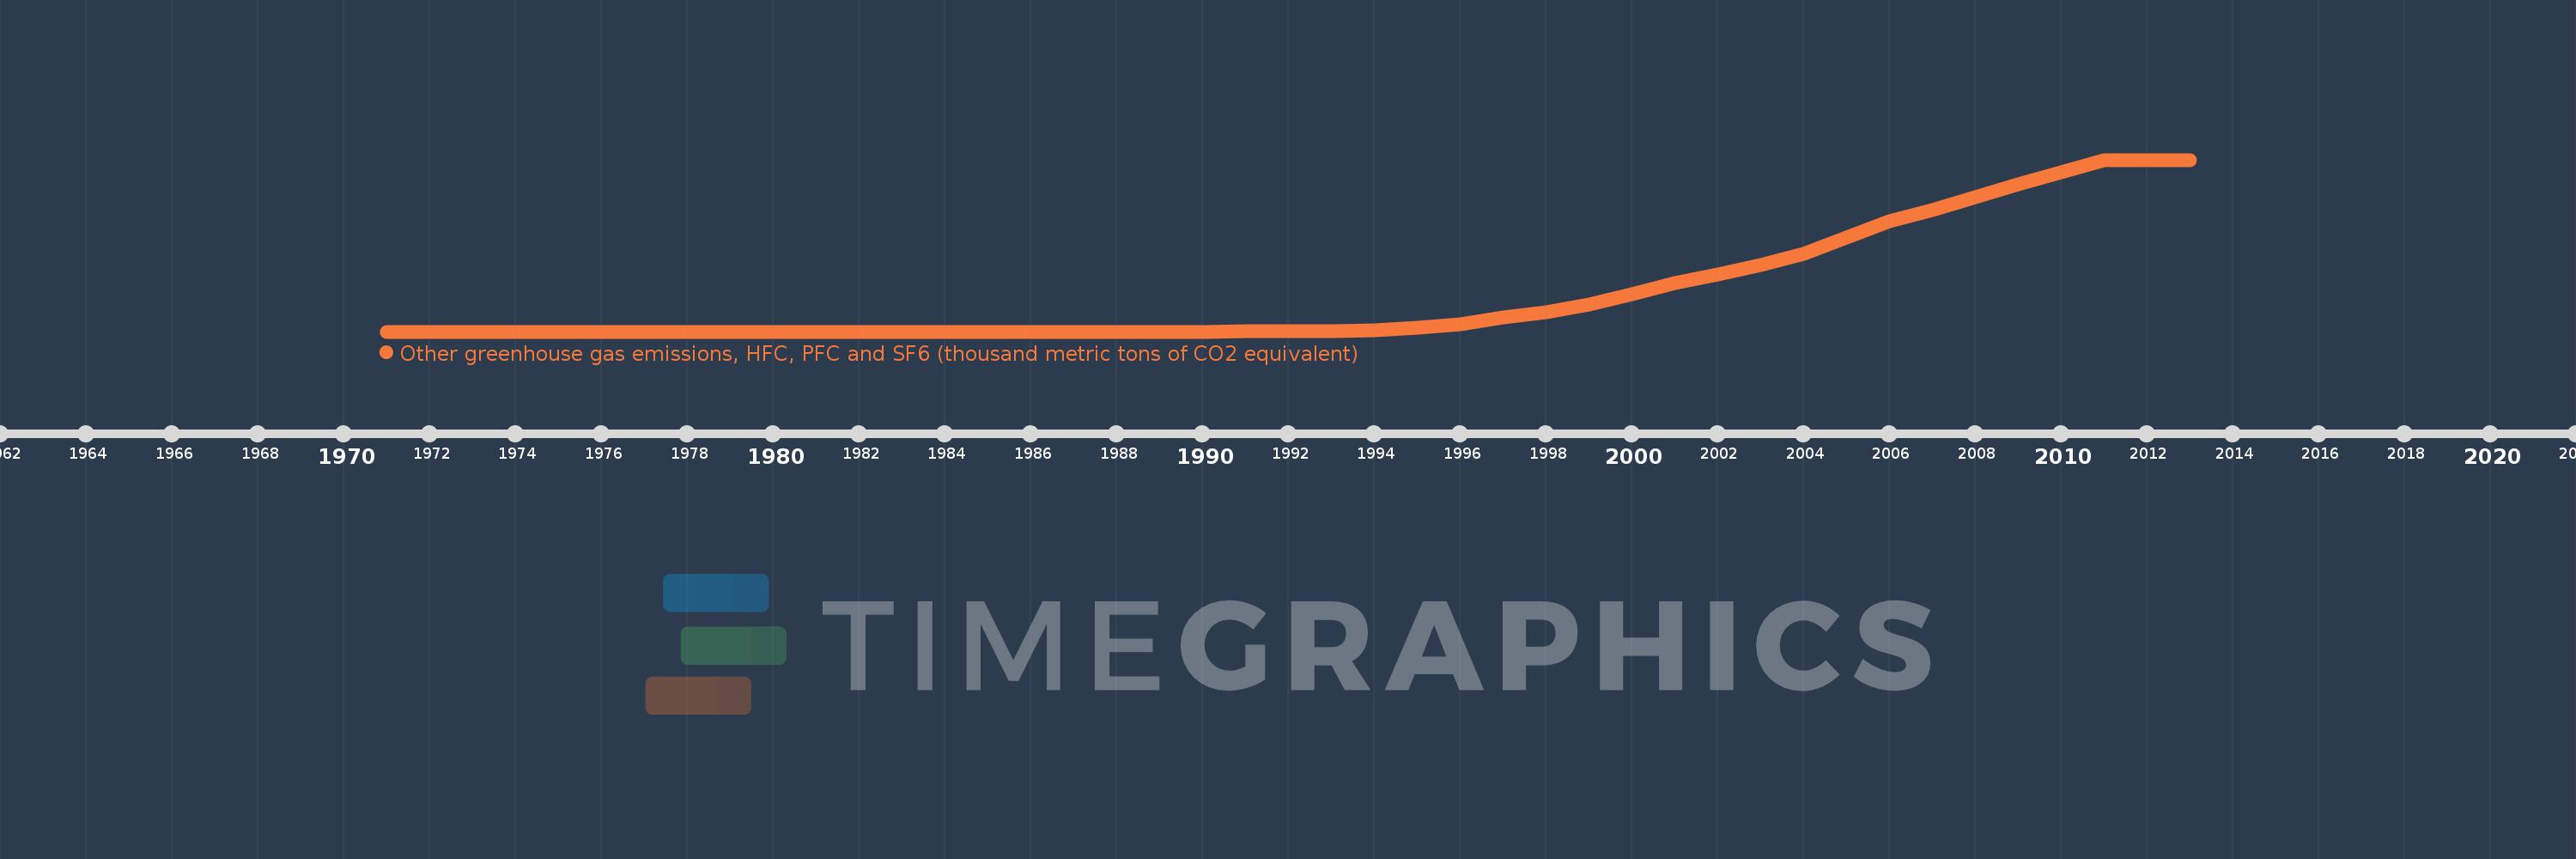
Other greenhouse gas emissions, HFC, PFC and SF6 (thousand metric tons of CO2 equivalent)
2013,2012,2011,2010,2009,2008,2007,2006,2005,2004,2003,2002,2001,2000,1999,1998,1997,1996,1995,1994,1993,1992,1991,1990,1989,1988,1987,1986,1985,1984,1983,1982,1981,1980,1979,1978,1977,1976,1975,1974,1973,1972,1971
Cette statistique dans les autres pays:
AfghanistanAlbaniaAlgeriaAmerican SamoaAngolaAntigua and BarbudaArab WorldArgentinaArmeniaArubaAustraliaAustriaAzerbaijanBahamas, TheBahrainBangladeshBarbadosBelarusBelgiumBelizeBeninBermudaBhutanBoliviaBosnia and HerzegovinaBotswanaBrazilBritish Virgin IslandsBrunei DarussalamBulgariaBurkina FasoBurundiCabo VerdeCambodiaCameroonCanadaCaribbean small statesCayman IslandsCentral African RepublicCentral Europe and the BalticsChadChileChinaColombiaComorosCongo, Dem. Rep.Congo, Rep.Costa RicaCote d'IvoireCroatiaCubaCyprusCzech RepublicDenmarkDjiboutiDominicaDominican RepublicEarly-demographic dividendEast Asia & PacificEast Asia & Pacific (excluding high income)East Asia & Pacific (IDA & IBRD countries)EcuadorEgypt, Arab Rep.El SalvadorEquatorial GuineaEritreaEstoniaEthiopiaEuro areaEurope & Central AsiaEurope & Central Asia (excluding high income)Europe & Central Asia (IDA & IBRD countries)European UnionFaroe IslandsFijiFinlandFragile and conflict affected situationsFranceFrench PolynesiaGabonGambia, TheGeorgiaGermanyGhanaGibraltarGreeceGreenlandGrenadaGuamGuatemalaGuineaGuinea-BissauGuyanaHaitiHeavily indebted poor countries (HIPC)High incomeHondurasHong Kong SAR, ChinaHungaryIBRD onlyIcelandIDA & IBRD totalIDA blendIDA onlyIDA totalIndiaIndonesiaIran, Islamic Rep.IraqIrelandIsraelItalyJamaicaJapanJordanKazakhstanKenyaKiribatiKorea, Dem. People’s Rep.Korea, Rep.KuwaitKyrgyz RepublicLao PDRLate-demographic dividendLatin America & Caribbean Latin America & Caribbean (excluding high income)Latin America & the Caribbean (IDA & IBRD countries)LatviaLeast developed countries: UN classificationLebanonLesothoLiberiaLibyaLithuaniaLow & middle incomeLow incomeLower middle incomeLuxembourgMacao SAR, ChinaMacedonia, FYRMadagascarMalawiMalaysiaMaldivesMaliMaltaMauritaniaMauritiusMexicoMiddle East & North AfricaMiddle East & North Africa (excluding high income)Middle East & North Africa (IDA & IBRD countries)Middle incomeMoldovaMongoliaMoroccoMozambiqueMyanmarNamibiaNauruNepalNetherlandsNew CaledoniaNew ZealandNicaraguaNigerNigeriaNorth AmericaNorwayOECD membersOmanOther small statesPacific island small statesPakistanPanamaPapua New GuineaParaguayPeruPhilippinesPolandPortugalPost-demographic dividendPre-demographic dividendPuerto RicoQatarRomaniaRussian FederationRwandaSamoaSao Tome and PrincipeSaudi ArabiaSenegalSeychellesSierra LeoneSingaporeSlovak RepublicSloveniaSmall statesSolomon IslandsSomaliaSouth AfricaSouth AsiaSouth Asia (IDA & IBRD)SpainSri LankaSt. Kitts and NevisSt. LuciaSt. Vincent and the GrenadinesSub-Saharan Africa Sub-Saharan Africa (excluding high income)Sub-Saharan Africa (IDA & IBRD countries)SudanSurinameSwazilandSwedenSwitzerlandSyrian Arab RepublicTajikistanTanzaniaThailandTimor-LesteTogoTongaTrinidad and TobagoTunisiaTurkeyTurkmenistanTurks and Caicos IslandsTuvaluUgandaUkraineUnited Arab EmiratesUnited KingdomUnited StatesUpper middle incomeUruguayUzbekistanVanuatuVenezuela, RBVietnamVirgin Islands (U.S.)WorldYemen, Rep.ZambiaZimbabwe La ligne de temps
Cette échelle de temps montre un graphique de 1971 année à 2013 année Antigua and Barbuda. Les données jusqu'à 1970 année ne sont pas présentés. Quantité d'observations actuelles selon dates: 43.
Source (désignation):
Les indicateurs du développement mondiale
Source (organisation):
World Bank staff estimates from original source: European Commission, Joint Research Centre (JRC)/Netherlands Environmental Assessment Agency (PBL). Emission Database for Global Atmospheric Research (EDGAR): http://edgar.jrc.ec.europa.eu/.
Catégories:
Climate Change, Environment
Dernière mise à jour
23 avr. 2017
Les indicateurs de changement de valeurs selon les années
Pour la date d''observation
Valeur
Changement absolu
Le changement par rapport à la valeur précédente
1 janv. 1972
0.0
+0.0
-125.0%
1 janv. 1973
0.0
+0.0
600.0%
1 janv. 1974
0.0
0.0
-85.71%
1 janv. 1975
0.0
+0.0
1.7 milles%
1 janv. 1976
0.0
0.0
-44.44%
1 janv. 1977
0.0
0.0
-120.0%
1 janv. 1978
0.0
0.0
50.0%
1 janv. 1979
0.0
+0.0
-766.67%
1 janv. 1980
0.0
0.0
-55.0%
1 janv. 1981
0.0
0.0
-300.0%
1 janv. 1982
0.0
+0.0
-133.33%
1 janv. 1983
0.0
0.0
-66.67%
1 janv. 1984
0.0
+0.0
900.0%
1 janv. 1986
0.0
0.0
-50.0%
1 janv. 1987
0.0
0.0
-340.0%
1 janv. 1988
0.0
+0.0
-75.0%
1 janv. 1989
0.0
0.0
166.67%
1 janv. 1990
0.0
+0.0
-175.0%
1 janv. 1991
0.001
+0.001
6.15 billions%
1 janv. 1992
0.007
+0.006
449.62%
1 janv. 1993
0.021
+0.014
190.28%
1 janv. 1994
0.09
+0.069
329.67%
1 janv. 1995
0.223
+0.133
148.33%
1 janv. 1996
0.437
+0.214
95.96%
1 janv. 1997
0.797
+0.36
82.38%
1 janv. 1998
1.1
+0.303
38.02%
1 janv. 1999
1.55
+0.45
40.91%
1 janv. 2000
2.15
+0.6
38.71%
1 janv. 2001
2.76
+0.61
28.37%
1 janv. 2002
3.24
+0.48
17.39%
1 janv. 2003
3.78
+0.54
16.67%
1 janv. 2004
4.46
+0.68
17.99%
1 janv. 2005
5.38
+0.92
20.63%
1 janv. 2006
6.31
+0.93
17.29%
1 janv. 2007
6.95
+0.64
10.14%
1 janv. 2008
7.68
+0.73
10.5%
1 janv. 2009
8.41
+0.73
9.51%
1 janv. 2010
9.11
+0.7
8.32%
1 janv. 2011
9.81
+0.7
7.68%
1 janv. 2012
9.81
+0.0
0.0%
1 janv. 2013
9.81
+0.0
0.0%
Classement des pays selon les statistiques actuelles par années


Commentaires: