29
/fr/
fr
AIzaSyAYiBZKx7MnpbEhh9jyipgxe19OcubqV5w
April 1, 2024
68861
Antigua and Barbuda
ATG
true
2
1
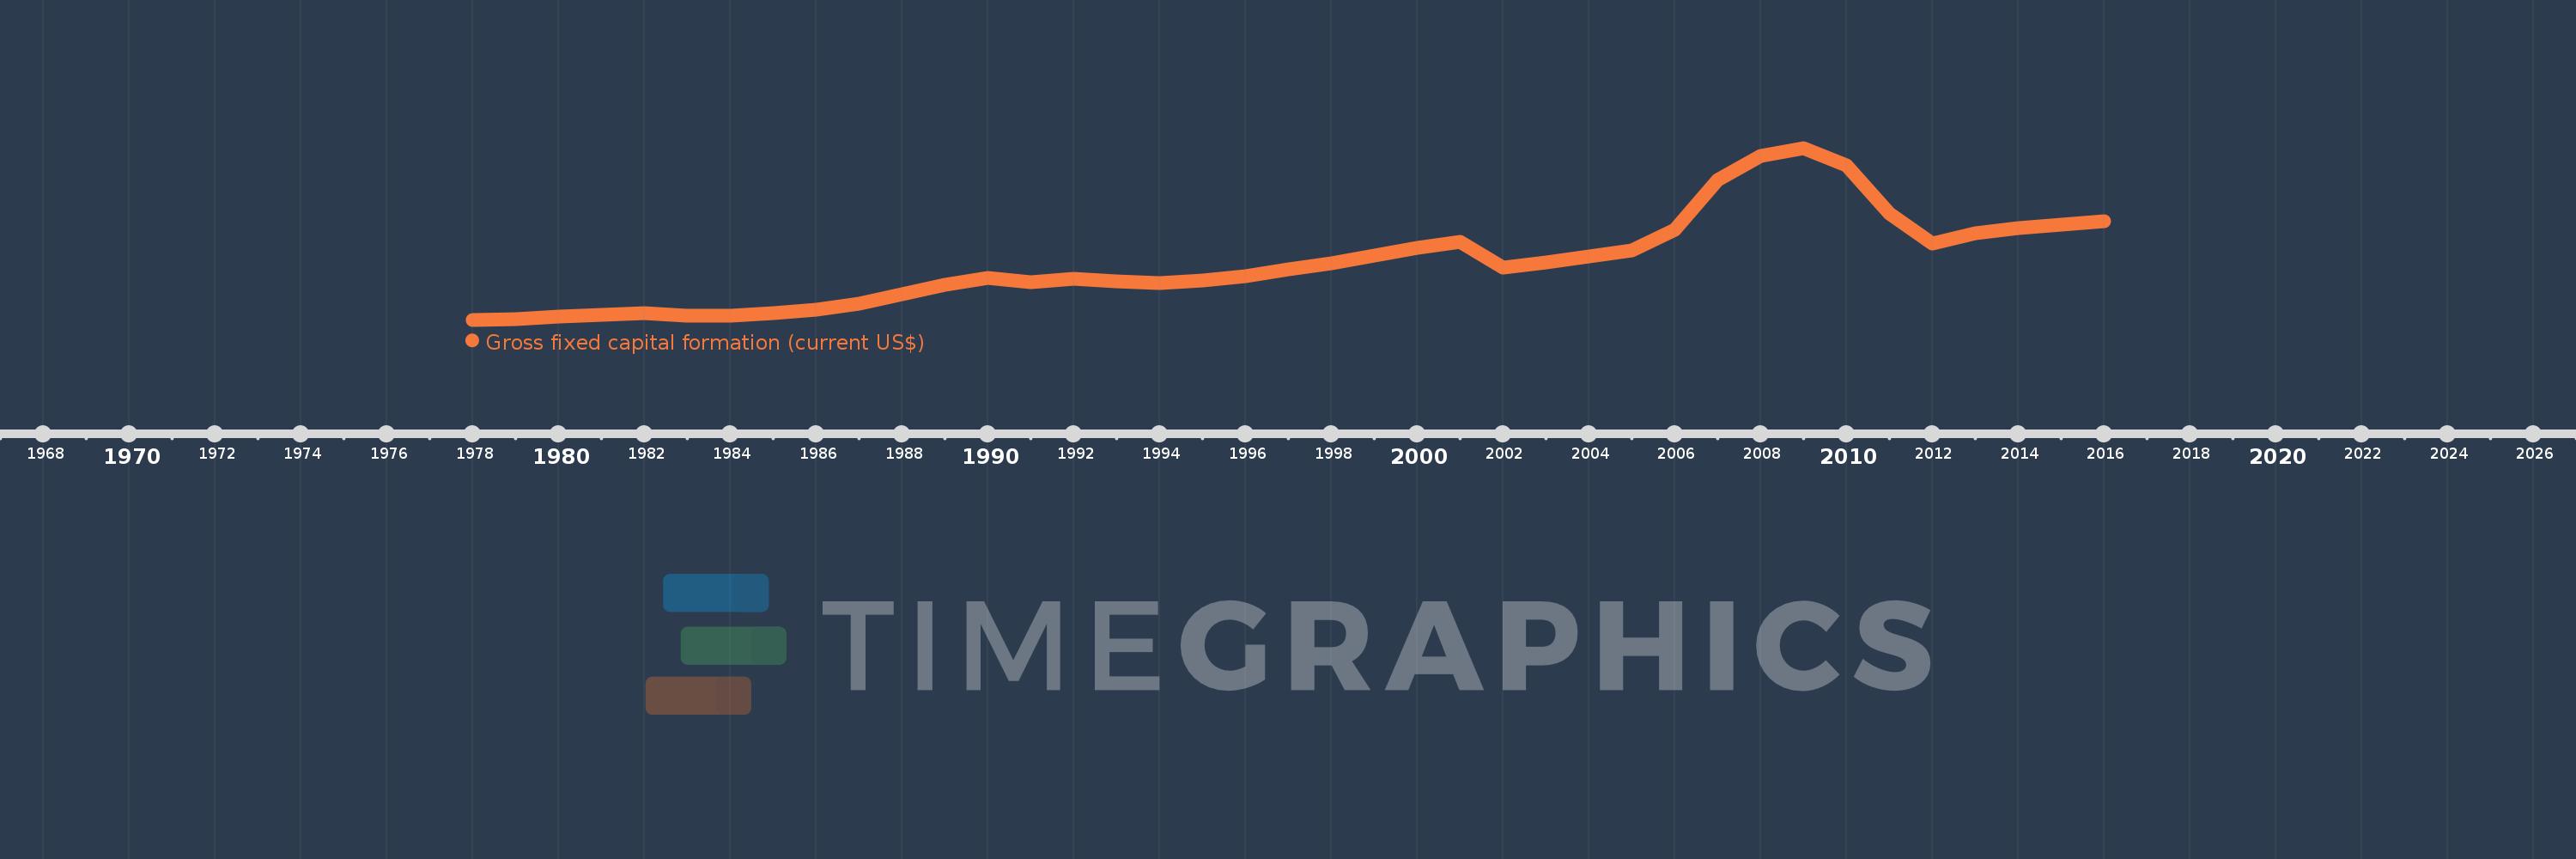
Gross fixed capital formation (current US$)
2016,2015,2014,2013,2012,2011,2010,2009,2008,2007,2006,2005,2004,2003,2002,2001,2000,1999,1998,1997,1996,1995,1994,1993,1992,1991,1990,1989,1988,1987,1986,1985,1984,1983,1982,1981,1980,1979,1978
Cette statistique dans les autres pays:
AfghanistanAlbaniaAlgeriaAngolaAntigua and BarbudaArab WorldArgentinaArmeniaArubaAustraliaAustriaAzerbaijanBahamas, TheBahrainBangladeshBarbadosBelarusBelgiumBelizeBeninBermudaBhutanBoliviaBosnia and HerzegovinaBotswanaBrazilBrunei DarussalamBulgariaBurkina FasoBurundiCabo VerdeCambodiaCameroonCanadaCaribbean small statesCentral African RepublicCentral Europe and the BalticsChadChileChinaColombiaComorosCongo, Dem. Rep.Congo, Rep.Costa RicaCote d'IvoireCroatiaCubaCyprusCzech RepublicDenmarkDjiboutiDominicaDominican RepublicEarly-demographic dividendEast Asia & PacificEast Asia & Pacific (excluding high income)East Asia & Pacific (IDA & IBRD countries)EcuadorEgypt, Arab Rep.El SalvadorEquatorial GuineaEritreaEstoniaEthiopiaEuro areaEurope & Central AsiaEurope & Central Asia (excluding high income)Europe & Central Asia (IDA & IBRD countries)European UnionFijiFinlandFragile and conflict affected situationsFranceGabonGambia, TheGeorgiaGermanyGhanaGreeceGrenadaGuatemalaGuineaGuinea-BissauGuyanaHaitiHeavily indebted poor countries (HIPC)High incomeHondurasHong Kong SAR, ChinaHungaryIBRD onlyIcelandIDA & IBRD totalIDA blendIDA onlyIDA totalIndiaIndonesiaIran, Islamic Rep.IraqIrelandIsraelItalyJamaicaJapanJordanKazakhstanKenyaKiribatiKorea, Rep.KosovoKuwaitKyrgyz RepublicLao PDRLate-demographic dividendLatin America & Caribbean Latin America & Caribbean (excluding high income)Latin America & the Caribbean (IDA & IBRD countries)LatviaLeast developed countries: UN classificationLebanonLesothoLiberiaLibyaLithuaniaLow & middle incomeLow incomeLower middle incomeLuxembourgMacao SAR, ChinaMacedonia, FYRMadagascarMalawiMalaysiaMaldivesMaliMaltaMauritaniaMauritiusMexicoMicronesia, Fed. Sts.Middle East & North AfricaMiddle East & North Africa (excluding high income)Middle East & North Africa (IDA & IBRD countries)Middle incomeMoldovaMongoliaMontenegroMoroccoMozambiqueNamibiaNepalNetherlandsNew CaledoniaNew ZealandNicaraguaNigerNigeriaNorth AmericaNorwayOECD membersOmanPakistanPanamaPapua New GuineaParaguayPeruPhilippinesPolandPortugalPost-demographic dividendPre-demographic dividendPuerto RicoRomaniaRussian FederationRwandaSaudi ArabiaSenegalSerbiaSeychellesSierra LeoneSingaporeSlovak RepublicSloveniaSolomon IslandsSomaliaSouth AfricaSouth AsiaSouth Asia (IDA & IBRD)South SudanSpainSri LankaSt. Kitts and NevisSt. LuciaSt. Vincent and the GrenadinesSub-Saharan Africa Sub-Saharan Africa (excluding high income)Sub-Saharan Africa (IDA & IBRD countries)SudanSurinameSwazilandSwedenSwitzerlandSyrian Arab RepublicTajikistanTanzaniaThailandTimor-LesteTogoTongaTrinidad and TobagoTunisiaTurkeyTurkmenistanUgandaUkraineUnited Arab EmiratesUnited KingdomUnited StatesUpper middle incomeUruguayUzbekistanVanuatuVenezuela, RBVietnamWest Bank and GazaWorldYemen, Rep.ZambiaZimbabwe La ligne de temps
Cette échelle de temps montre un graphique de 1978 année à 2016 année Antigua and Barbuda. Les données jusqu'à 1977 année ne sont pas présentés. Quantité d'observations actuelles selon dates: 39.
Source (désignation):
Les indicateurs du développement mondiale
Source (organisation):
World Bank national accounts data, and OECD National Accounts data files.
Catégories:
Economy & Growth
Dernière mise à jour
23 avr. 2017
Les indicateurs de changement de valeurs selon les années
Minimum:
13.656 mln.
1 janv. 1978
Maximum:
512.733 mln.
1 janv. 2009
Pour la date d''observation
Valeur
Changement absolu
Le changement par rapport à la valeur précédente
1 janv. 1978
13.656 mln.
+13.656 mln.
0.0%
1 janv. 1979
14.444 mln.
+788.889 milles
5.78%
1 janv. 1980
22.407 mln.
+7.963 mln.
55.13%
1 janv. 1981
28.041 mln.
+5.633 mln.
25.14%
1 janv. 1982
33.481 mln.
+5.441 mln.
19.4%
1 janv. 1983
24.659 mln.
-8.822 mln.
-26.35%
1 janv. 1984
24.778 mln.
+118.519 milles
0.48%
1 janv. 1985
33.044 mln.
+8.267 mln.
33.36%
1 janv. 1986
43.1 mln.
+10.056 mln.
30.43%
1 janv. 1987
61.104 mln.
+18.004 mln.
41.77%
1 janv. 1988
88.393 mln.
+27.289 mln.
44.66%
1 janv. 1989
115.878 mln.
+27.485 mln.
31.09%
1 janv. 1990
135.626 mln.
+19.748 mln.
17.04%
1 janv. 1991
122.067 mln.
-13.559 mln.
-10.0%
1 janv. 1992
132.293 mln.
+10.226 mln.
8.38%
1 janv. 1993
126.219 mln.
-6.074 mln.
-4.59%
1 janv. 1994
119.915 mln.
-6.304 mln.
-4.99%
1 janv. 1995
128.459 mln.
+8.544 mln.
7.13%
1 janv. 1996
140.259 mln.
+11.8 mln.
9.19%
1 janv. 1997
160.222 mln.
+19.963 mln.
14.23%
1 janv. 1998
176.504 mln.
+16.281 mln.
10.16%
1 janv. 1999
201.207 mln.
+24.704 mln.
14.0%
1 janv. 2000
221.648 mln.
+20.441 mln.
10.16%
1 janv. 2001
239.535 mln.
+17.886 mln.
8.07%
1 janv. 2002
164.059 mln.
-75.476 mln.
-31.51%
1 janv. 2003
180.245 mln.
+16.186 mln.
9.87%
1 janv. 2004
198.631 mln.
+18.386 mln.
10.2%
1 janv. 2005
216.221 mln.
+17.59 mln.
8.86%
1 janv. 2006
275.248 mln.
+59.027 mln.
27.3%
1 janv. 2007
418.876 mln.
+143.627 mln.
52.18%
1 janv. 2008
490.199 mln.
+71.324 mln.
17.03%
1 janv. 2009
512.733 mln.
+22.534 mln.
4.6%
1 janv. 2010
462.974 mln.
-49.759 mln.
-9.7%
1 janv. 2011
322.981 mln.
-139.993 mln.
-30.24%
1 janv. 2012
235.944 mln.
-87.037 mln.
-26.95%
1 janv. 2013
265.389 mln.
+29.444 mln.
12.48%
1 janv. 2014
280.313 mln.
+14.924 mln.
5.62%
1 janv. 2015
288.925 mln.
+8.612 mln.
3.07%
1 janv. 2016
300.37 mln.
+11.445 mln.
3.96%
Classement des pays selon les statistiques actuelles par années


Commentaires: