29
/fr/
fr
AIzaSyAYiBZKx7MnpbEhh9jyipgxe19OcubqV5w
April 1, 2024
66734
Algeria
DZA
true
2
1
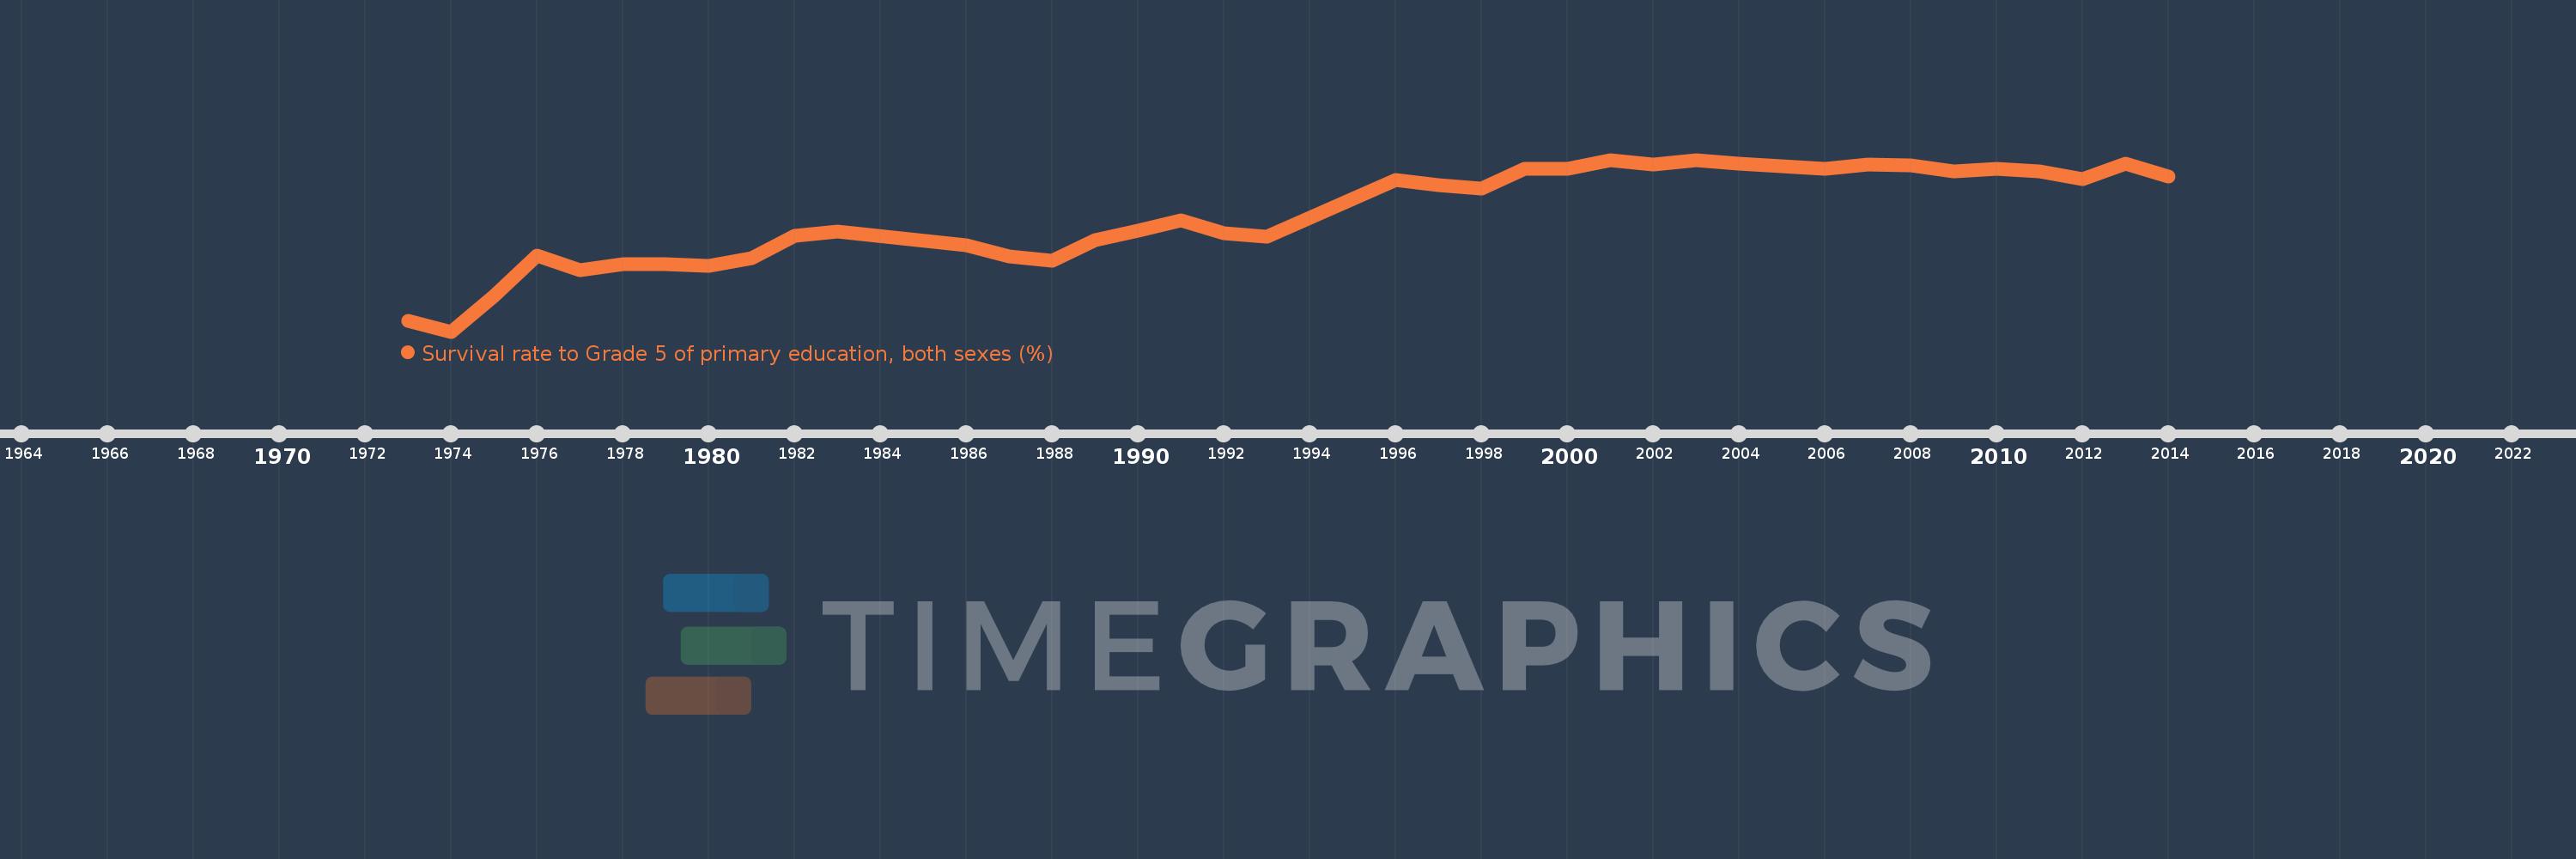
Survival rate to Grade 5 of primary education, both sexes (%)
2014,2013,2012,2011,2010,2009,2008,2007,2006,2005,2004,2003,2002,2001,2000,1999,1998,1997,1996,1993,1992,1991,1990,1989,1988,1987,1986,1983,1982,1981,1980,1979,1978,1977,1976,1975,1974,1973
Cette statistique dans les autres pays:
AfghanistanAlbaniaAlgeriaAndorraAngolaAntigua and BarbudaArab WorldArgentinaArubaBahamas, TheBahrainBangladeshBarbadosBelarusBelgiumBelizeBeninBermudaBhutanBoliviaBosnia and HerzegovinaBotswanaBritish Virgin IslandsBrunei DarussalamBurkina FasoBurundiCabo VerdeCambodiaCameroonCanadaCaribbean small statesCayman IslandsCentral African RepublicChadChileChinaColombiaComorosCongo, Dem. Rep.Congo, Rep.Costa RicaCote d'IvoireCubaCyprusCzech RepublicDenmarkDjiboutiDominicaDominican RepublicEarly-demographic dividendEast Asia & PacificEast Asia & Pacific (excluding high income)East Asia & Pacific (IDA & IBRD countries)EcuadorEgypt, Arab Rep.El SalvadorEquatorial GuineaEritreaEstoniaEthiopiaFijiFinlandFranceGabonGambia, TheGeorgiaGhanaGreeceGrenadaGuatemalaGuineaGuinea-BissauGuyanaHaitiHeavily indebted poor countries (HIPC)HondurasHong Kong SAR, ChinaHungaryIBRD onlyIcelandIDA blendIDA onlyIDA totalIndiaIndonesiaIran, Islamic Rep.IraqIrelandIsraelItalyJamaicaJapanJordanKenyaKiribatiKorea, Rep.KuwaitLao PDRLate-demographic dividendLatviaLeast developed countries: UN classificationLebanonLesothoLiberiaLibyaLiechtensteinLow incomeLower middle incomeLuxembourgMacao SAR, ChinaMadagascarMalawiMalaysiaMaldivesMaliMaltaMarshall IslandsMauritaniaMauritiusMexicoMiddle East & North AfricaMiddle East & North Africa (excluding high income)Middle East & North Africa (IDA & IBRD countries)MonacoMontenegroMoroccoMozambiqueMyanmarNamibiaNepalNetherlandsNicaraguaNigerNigeriaNorwayOmanOther small statesPacific island small statesPakistanPanamaPapua New GuineaParaguayPeruPhilippinesPolandPortugalPre-demographic dividendQatarRwandaSamoaSan MarinoSao Tome and PrincipeSaudi ArabiaSenegalSeychellesSierra LeoneSingaporeSloveniaSolomon IslandsSouth AfricaSouth AsiaSouth Asia (IDA & IBRD)SpainSri LankaSt. Kitts and NevisSt. LuciaSt. Vincent and the GrenadinesSub-Saharan Africa Sub-Saharan Africa (excluding high income)Sub-Saharan Africa (IDA & IBRD countries)SudanSurinameSwazilandSwedenSwitzerlandSyrian Arab RepublicTanzaniaThailandTimor-LesteTogoTongaTrinidad and TobagoTunisiaTurkeyTuvaluUgandaUnited Arab EmiratesUpper middle incomeUruguayVanuatuVenezuela, RBVietnamYemen, Rep.ZambiaZimbabwe La ligne de temps
Cette échelle de temps montre un graphique de 1973 année à 2014 année Algeria. Les données jusqu'à 1972 année ne sont pas présentés. Quantité d'observations actuelles selon dates: 38.
Source (désignation):
Les indicateurs du développement mondiale
Source (organisation):
UNESCO Institute for Statistics
Catégories:
Education
Dernière mise à jour
23 avr. 2017
Les indicateurs de changement de valeurs selon les années
Minimum:
58.781
1 janv. 1974
Maximum:
97.092
1 janv. 2001
Pour la date d''observation
Valeur
Changement absolu
Le changement par rapport à la valeur précédente
1 janv. 1973
61.221
+61.221
0.0%
1 janv. 1974
58.781
-2.44
-3.99%
1 janv. 1975
66.775
+7.994
13.6%
1 janv. 1976
75.676
+8.901
13.33%
1 janv. 1977
72.561
-3.115
-4.12%
1 janv. 1978
73.85
+1.289
1.78%
1 janv. 1979
73.911
+0.061
0.08%
1 janv. 1980
73.366
-0.545
-0.74%
1 janv. 1981
75.213
+1.847
2.52%
1 janv. 1982
80.086
+4.873
6.48%
1 janv. 1983
81.049
+0.963
1.2%
1 janv. 1986
77.946
-3.103
-3.83%
1 janv. 1987
75.56
-2.386
-3.06%
1 janv. 1988
74.505
-1.055
-1.4%
1 janv. 1989
79.223
+4.718
6.33%
1 janv. 1990
81.343
+2.12
2.68%
1 janv. 1991
83.534
+2.191
2.69%
1 janv. 1992
80.648
-2.886
-3.46%
1 janv. 1993
79.927
-0.721
-0.89%
1 janv. 1996
92.662
+12.735
15.93%
1 janv. 1997
91.411
-1.251
-1.35%
1 janv. 1998
90.582
-0.829
-0.91%
1 janv. 1999
95.036
+4.454
4.92%
1 janv. 2000
95.002
-0.034
-0.04%
1 janv. 2001
97.092
+2.09
2.2%
1 janv. 2002
95.985
-1.107
-1.14%
1 janv. 2003
96.97
+0.985
1.03%
1 janv. 2004
96.185
-0.784
-0.81%
1 janv. 2005
95.607
-0.578
-0.6%
1 janv. 2006
95.173
-0.434
-0.45%
1 janv. 2007
95.981
+0.808
0.85%
1 janv. 2008
95.909
-0.073
-0.08%
1 janv. 2009
94.514
-1.394
-1.45%
1 janv. 2010
95.039
+0.525
0.56%
1 janv. 2011
94.553
-0.486
-0.51%
1 janv. 2012
92.768
-1.785
-1.89%
1 janv. 2013
96.21
+3.442
3.71%
1 janv. 2014
93.413
-2.797
-2.91%
Classement des pays selon les statistiques actuelles par années


Commentaires: