29
/fr/
fr
AIzaSyAYiBZKx7MnpbEhh9jyipgxe19OcubqV5w
April 1, 2024
65639
Algeria
DZA
true
2
1
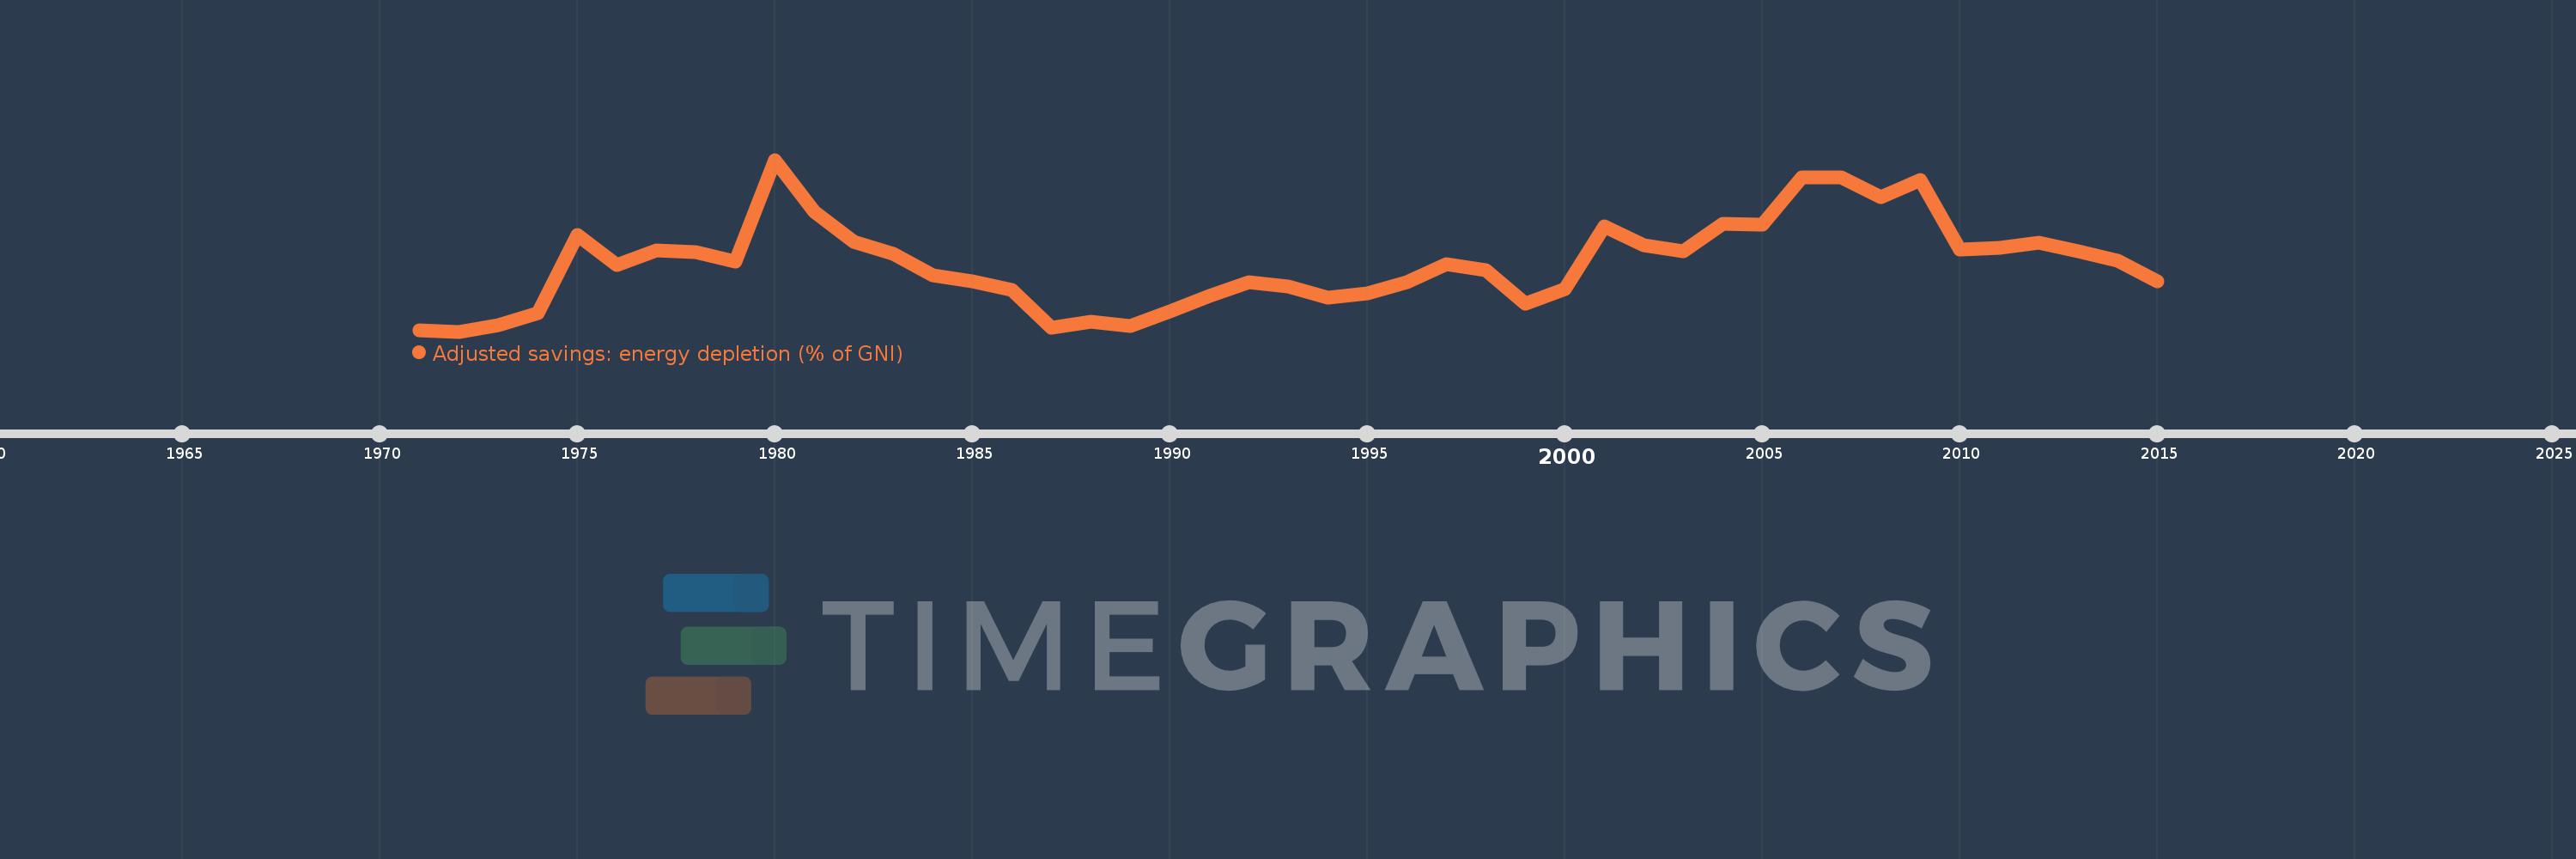
Adjusted savings: energy depletion (% of GNI)
2015,2014,2013,2012,2011,2010,2009,2008,2007,2006,2005,2004,2003,2002,2001,2000,1999,1998,1997,1996,1995,1994,1993,1992,1991,1990,1989,1988,1987,1986,1985,1984,1983,1982,1981,1980,1979,1978,1977,1976,1975,1974,1973,1972,1971
Cette statistique dans les autres pays:
AfghanistanAlbaniaAlgeriaAmerican SamoaAndorraAngolaAntigua and BarbudaArab WorldArgentinaArmeniaAustraliaAustriaAzerbaijanBahamas, TheBahrainBangladeshBarbadosBelarusBelgiumBelizeBeninBermudaBhutanBoliviaBosnia and HerzegovinaBotswanaBrazilBrunei DarussalamBulgariaBurkina FasoBurundiCabo VerdeCambodiaCameroonCanadaCaribbean small statesCentral African RepublicCentral Europe and the BalticsChadChannel IslandsChileChinaColombiaComorosCongo, Dem. Rep.Congo, Rep.Costa RicaCote d'IvoireCroatiaCubaCyprusCzech RepublicDenmarkDjiboutiDominicaDominican RepublicEarly-demographic dividendEast Asia & PacificEast Asia & Pacific (excluding high income)East Asia & Pacific (IDA & IBRD countries)EcuadorEgypt, Arab Rep.El SalvadorEquatorial GuineaEritreaEstoniaEthiopiaEuro areaEurope & Central AsiaEurope & Central Asia (excluding high income)Europe & Central Asia (IDA & IBRD countries)European UnionFaroe IslandsFijiFinlandFragile and conflict affected situationsFranceFrench PolynesiaGabonGambia, TheGeorgiaGermanyGhanaGreeceGreenlandGrenadaGuatemalaGuineaGuinea-BissauGuyanaHaitiHeavily indebted poor countries (HIPC)High incomeHondurasHong Kong SAR, ChinaHungaryIBRD onlyIcelandIDA & IBRD totalIDA blendIDA onlyIDA totalIndiaIndonesiaIran, Islamic Rep.IraqIrelandIsle of ManIsraelItalyJamaicaJapanJordanKazakhstanKenyaKiribatiKorea, Rep.KosovoKuwaitKyrgyz RepublicLao PDRLate-demographic dividendLatin America & Caribbean Latin America & Caribbean (excluding high income)Latin America & the Caribbean (IDA & IBRD countries)LatviaLeast developed countries: UN classificationLebanonLesothoLiberiaLibyaLiechtensteinLithuaniaLow & middle incomeLow incomeLower middle incomeLuxembourgMacao SAR, ChinaMacedonia, FYRMadagascarMalawiMalaysiaMaldivesMaliMaltaMarshall IslandsMauritaniaMauritiusMexicoMicronesia, Fed. Sts.Middle East & North AfricaMiddle East & North Africa (excluding high income)Middle East & North Africa (IDA & IBRD countries)Middle incomeMoldovaMonacoMongoliaMontenegroMoroccoMozambiqueMyanmarNamibiaNepalNetherlandsNew CaledoniaNew ZealandNicaraguaNigerNigeriaNorth AmericaNorwayOECD membersOmanOther small statesPacific island small statesPakistanPalauPanamaPapua New GuineaParaguayPeruPhilippinesPolandPortugalPost-demographic dividendPre-demographic dividendPuerto RicoQatarRomaniaRussian FederationRwandaSamoaSan MarinoSao Tome and PrincipeSaudi ArabiaSenegalSerbiaSeychellesSierra LeoneSingaporeSlovak RepublicSloveniaSmall statesSolomon IslandsSomaliaSouth AfricaSouth AsiaSouth Asia (IDA & IBRD)South SudanSpainSri LankaSt. Kitts and NevisSt. LuciaSt. Vincent and the GrenadinesSub-Saharan Africa Sub-Saharan Africa (excluding high income)Sub-Saharan Africa (IDA & IBRD countries)SudanSurinameSwazilandSwedenSwitzerlandSyrian Arab RepublicTajikistanTanzaniaThailandTimor-LesteTogoTongaTrinidad and TobagoTunisiaTurkeyTurkmenistanTuvaluUgandaUkraineUnited Arab EmiratesUnited KingdomUnited StatesUpper middle incomeUruguayUzbekistanVanuatuVenezuela, RBVietnamVirgin Islands (U.S.)West Bank and GazaWorldYemen, Rep.ZambiaZimbabwe La ligne de temps
Cette échelle de temps montre un graphique de 1971 année à 2015 année Algeria. Les données jusqu'à 1970 année ne sont pas présentés. Quantité d'observations actuelles selon dates: 45.
Source (désignation):
Les indicateurs du développement mondiale
Source (organisation):
World Bank staff estimates based on sources and methods in World Bank's "The Changing Wealth of Nations: Measuring Sustainable Development in the New Millennium" (2011).
Catégories:
Economy & Growth, Energy & Mining, Environment
Dernière mise à jour
23 avr. 2017
Les indicateurs de changement de valeurs selon les années
Minimum:
6.076
1 janv. 1972
Maximum:
34.026
1 janv. 1980
Pour la date d''observation
Valeur
Changement absolu
Le changement par rapport à la valeur précédente
1 janv. 1971
6.299
+6.299
0.0%
1 janv. 1972
6.076
-0.223
-3.54%
1 janv. 1973
7.167
+1.09
17.94%
1 janv. 1974
9.015
+1.848
25.79%
1 janv. 1975
21.832
+12.817
142.18%
1 janv. 1976
16.919
-4.913
-22.5%
1 janv. 1977
19.228
+2.309
13.65%
1 janv. 1978
19.009
-0.219
-1.14%
1 janv. 1979
17.402
-1.607
-8.45%
1 janv. 1980
34.026
+16.624
95.53%
1 janv. 1981
25.507
-8.518
-25.03%
1 janv. 1982
20.744
-4.763
-18.67%
1 janv. 1983
18.719
-2.026
-9.77%
1 janv. 1984
15.182
-3.536
-18.89%
1 janv. 1985
14.261
-0.921
-6.07%
1 janv. 1986
12.796
-1.465
-10.27%
1 janv. 1987
6.662
-6.134
-47.94%
1 janv. 1988
7.629
+0.967
14.52%
1 janv. 1989
6.916
-0.713
-9.35%
1 janv. 1990
9.42
+2.504
36.21%
1 janv. 1991
11.869
+2.449
26.0%
1 janv. 1992
14.145
+2.277
19.18%
1 janv. 1993
13.373
-0.772
-5.46%
1 janv. 1994
11.58
-1.794
-13.41%
1 janv. 1995
12.263
+0.684
5.91%
1 janv. 1996
14.145
+1.882
15.34%
1 janv. 1997
16.979
+2.834
20.03%
1 janv. 1998
16.094
-0.885
-5.21%
1 janv. 1999
10.678
-5.416
-33.65%
1 janv. 2000
12.999
+2.321
21.74%
1 janv. 2001
23.25
+10.251
78.86%
1 janv. 2002
20.171
-3.079
-13.24%
1 janv. 2003
19.126
-1.045
-5.18%
1 janv. 2004
23.615
+4.489
23.47%
1 janv. 2005
23.532
-0.082
-0.35%
1 janv. 2006
31.209
+7.676
32.62%
1 janv. 2007
31.184
-0.024
-0.08%
1 janv. 2008
28.008
-3.176
-10.18%
1 janv. 2009
30.746
+2.738
9.78%
1 janv. 2010
19.373
-11.373
-36.99%
1 janv. 2011
19.654
+0.281
1.45%
1 janv. 2012
20.54
+0.886
4.51%
1 janv. 2013
19.103
-1.437
-7.0%
1 janv. 2014
17.645
-1.458
-7.63%
1 janv. 2015
14.22
-3.425
-19.41%
Classement des pays selon les statistiques actuelles par années


Commentaires: