29
/fr/
fr
AIzaSyAYiBZKx7MnpbEhh9jyipgxe19OcubqV5w
April 1, 2024
63875
Afghanistan
AFG
true
2
1
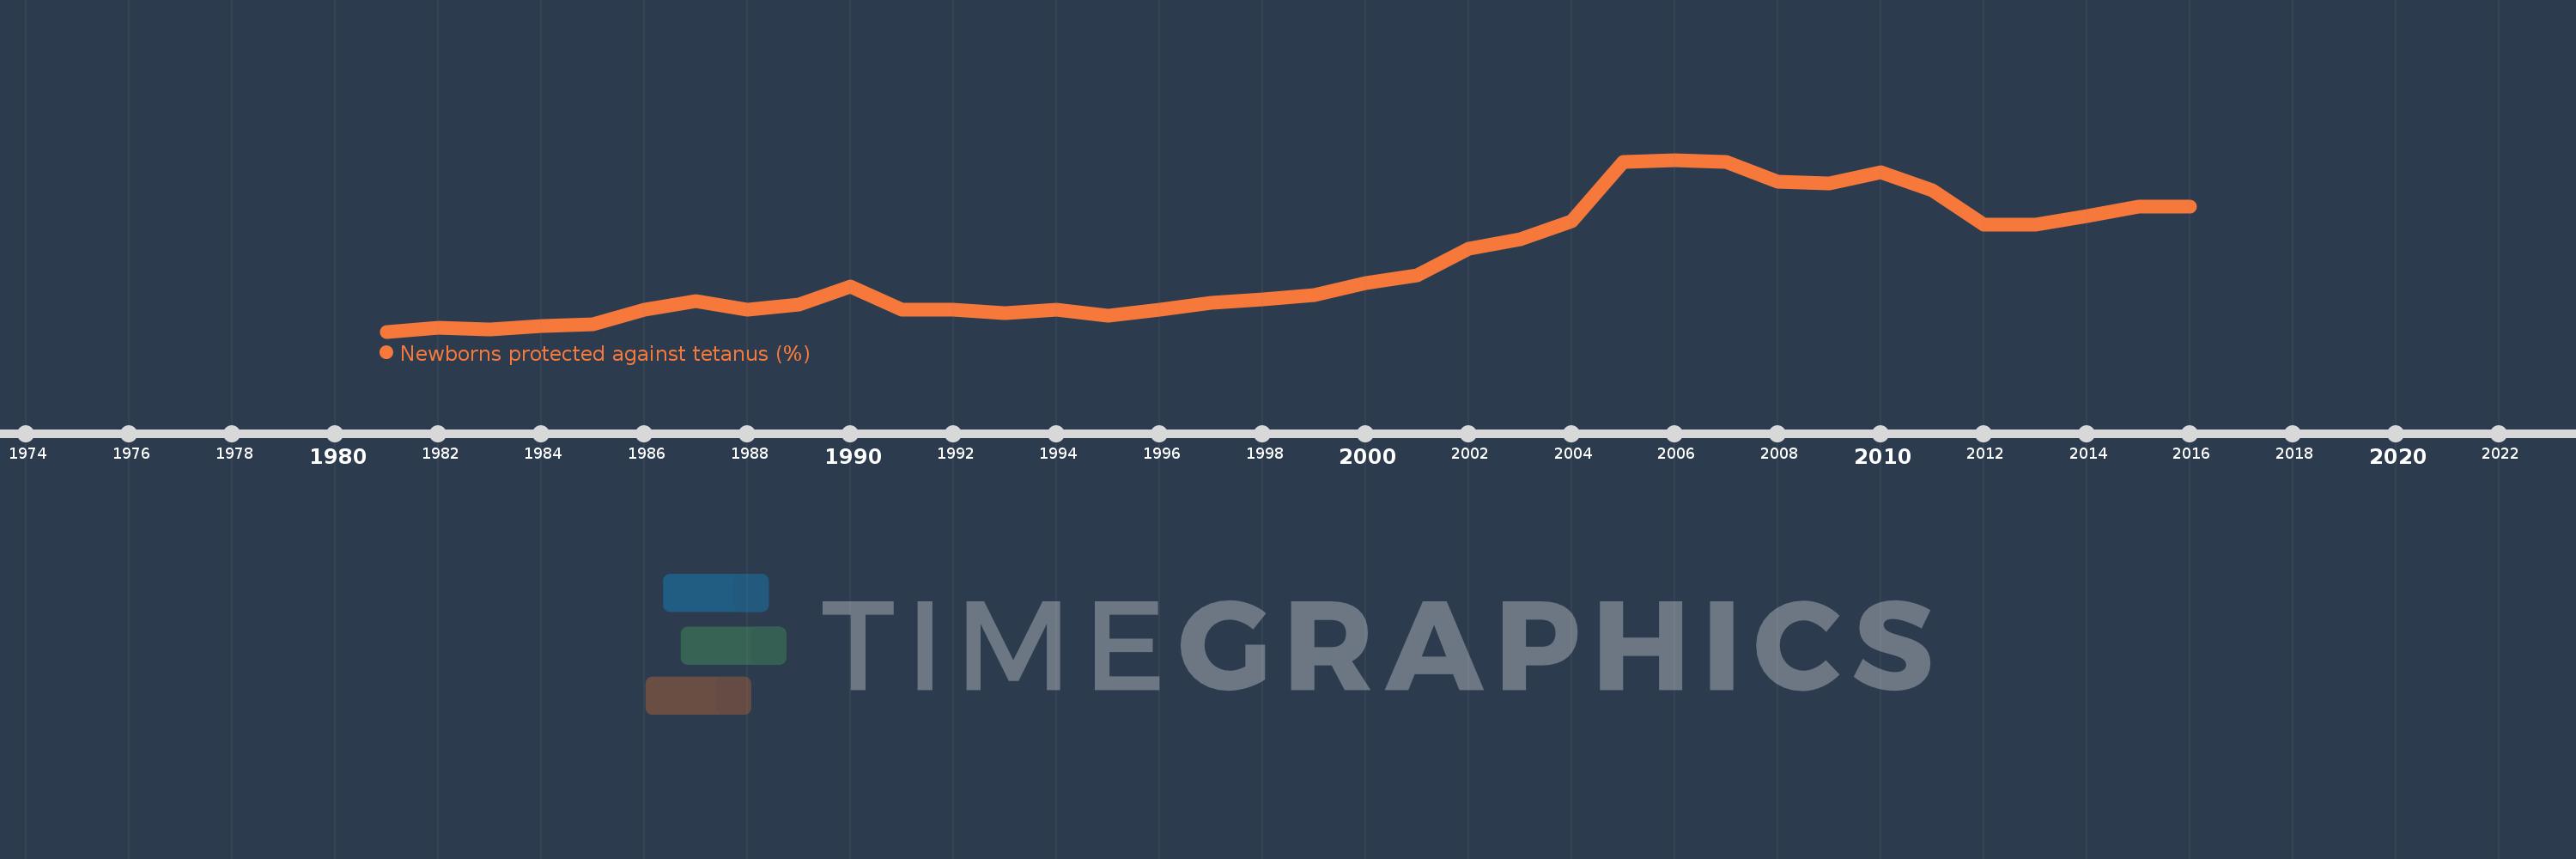
Newborns protected against tetanus (%)
2016,2015,2014,2013,2012,2011,2010,2009,2008,2007,2006,2005,2004,2003,2002,2001,2000,1999,1998,1997,1996,1995,1994,1993,1992,1991,1990,1989,1988,1987,1986,1985,1984,1983,1982,1981
Cette statistique dans les autres pays:
La ligne de temps
Cette échelle de temps montre un graphique de 1981 année à 2016 année Afghanistan. Les données jusqu'à 1980 année ne sont pas présentés. Quantité d'observations actuelles selon dates: 36.
Source (désignation):
Les indicateurs du développement mondiale
Source (organisation):
WHO and UNICEF (http://www.who.int/immunization/monitoring_surveillance/en/).
Catégories:
Health
Dernière mise à jour
23 avr. 2017
Les indicateurs de changement de valeurs selon les années
Pour la date d''observation
Valeur
Changement absolu
Le changement par rapport à la valeur précédente
1 janv. 1981
1.0
+1.0
0.0%
1 janv. 1982
3.0
+2.0
200.0%
1 janv. 1983
2.0
-1.0
-33.33%
1 janv. 1984
4.0
+2.0
100.0%
1 janv. 1985
5.0
+1.0
25.0%
1 janv. 1986
13.0
+8.0
160.0%
1 janv. 1987
18.0
+5.0
38.46%
1 janv. 1988
13.0
-5.0
-27.78%
1 janv. 1989
16.0
+3.0
23.08%
1 janv. 1990
26.0
+10.0
62.5%
1 janv. 1991
13.0
-13.0
-50.0%
1 janv. 1992
13.0
0.0
0.0%
1 janv. 1993
11.0
-2.0
-15.38%
1 janv. 1994
13.0
+2.0
18.18%
1 janv. 1995
10.0
-3.0
-23.08%
1 janv. 1996
13.0
+3.0
30.0%
1 janv. 1997
17.0
+4.0
30.77%
1 janv. 1998
19.0
+2.0
11.76%
1 janv. 1999
21.0
+2.0
10.53%
1 janv. 2000
28.0
+7.0
33.33%
1 janv. 2001
32.0
+4.0
14.29%
1 janv. 2002
47.0
+15.0
46.88%
1 janv. 2003
52.0
+5.0
10.64%
1 janv. 2004
62.0
+10.0
19.23%
1 janv. 2005
95.0
+33.0
53.23%
1 janv. 2006
96.0
+1.0
1.05%
1 janv. 2007
95.0
-1.0
-1.04%
1 janv. 2008
84.0
-11.0
-11.58%
1 janv. 2009
83.0
-1.0
-1.19%
1 janv. 2010
89.0
+6.0
7.23%
1 janv. 2011
79.0
-10.0
-11.24%
1 janv. 2012
60.0
-19.0
-24.05%
1 janv. 2013
60.0
0.0
0.0%
1 janv. 2014
65.0
+5.0
8.33%
1 janv. 2015
70.0
+5.0
7.69%
1 janv. 2016
70.0
0.0
0.0%
Classement des pays selon les statistiques actuelles par années


Commentaires: