30
/fr/
AIzaSyAYiBZKx7MnpbEhh9jyipgxe19OcubqV5w
April 1, 2024
59428
Sub-Saharan Africa
SSF
false
2
1
Trained teachers in preprimary education (% of total teachers)
2015,2014,2013,2012,2011,2010,2009,2008,2007,2006,2005,2004,2003,2002,2001,2000
Download
Bibliothèque de statistiques globales →Sub-Saharan Africa  →

Trained teachers in preprimary education (% of total teachers)

Cette statistique dans les autres pays:

AndorraAngolaAntigua and BarbudaArab WorldArmeniaArubaAzerbaijanBahamas, TheBahrainBarbadosBelarusBelizeBeninBermudaBhutanBoliviaBotswanaBritish Virgin IslandsBrunei DarussalamBurkina FasoBurundiCabo VerdeCambodiaCameroonCaribbean small statesCayman IslandsChadColombiaCongo, Dem. Rep.Congo, Rep.Costa RicaCote d'IvoireCroatiaCubaDjiboutiDominicaDominican RepublicEcuadorEgypt, Arab Rep.El SalvadorEritreaEthiopiaFragile and conflict affected situationsGambia, TheGeorgiaGhanaGibraltarGrenadaGuineaGuinea-BissauGuyanaHeavily indebted poor countries (HIPC)HondurasIDA blendIDA onlyIDA totalIran, Islamic Rep.IraqKazakhstanKenyaKuwaitKyrgyz RepublicLao PDRLatin America & Caribbean Latin America & Caribbean (excluding high income)Latin America & the Caribbean (IDA & IBRD countries)Least developed countries: UN classificationLebanonLiberiaLow incomeMacao SAR, ChinaMadagascarMalaysiaMaldivesMaliMarshall IslandsMauritaniaMauritiusMexicoMiddle East & North AfricaMiddle East & North Africa (excluding high income)Middle East & North Africa (IDA & IBRD countries)MoldovaMongoliaMoroccoMyanmarNamibiaNauruNepalNicaraguaNigerOmanOther small statesPacific island small statesPanamaParaguayPre-demographic dividendQatarRwandaSamoaSao Tome and PrincipeSaudi ArabiaSenegalSerbiaSeychellesSierra LeoneSmall statesSolomon IslandsSouth AfricaSouth SudanSt. Kitts and NevisSt. LuciaSt. Vincent and the GrenadinesSub-Saharan Africa Sub-Saharan Africa (excluding high income)Sub-Saharan Africa (IDA & IBRD countries)SurinameSwazilandSyrian Arab RepublicTajikistanTanzaniaTogoTongaTrinidad and TobagoTunisiaTuvaluUnited Arab EmiratesUzbekistanVanuatuVietnamWest Bank and GazaZimbabwe

La ligne de temps

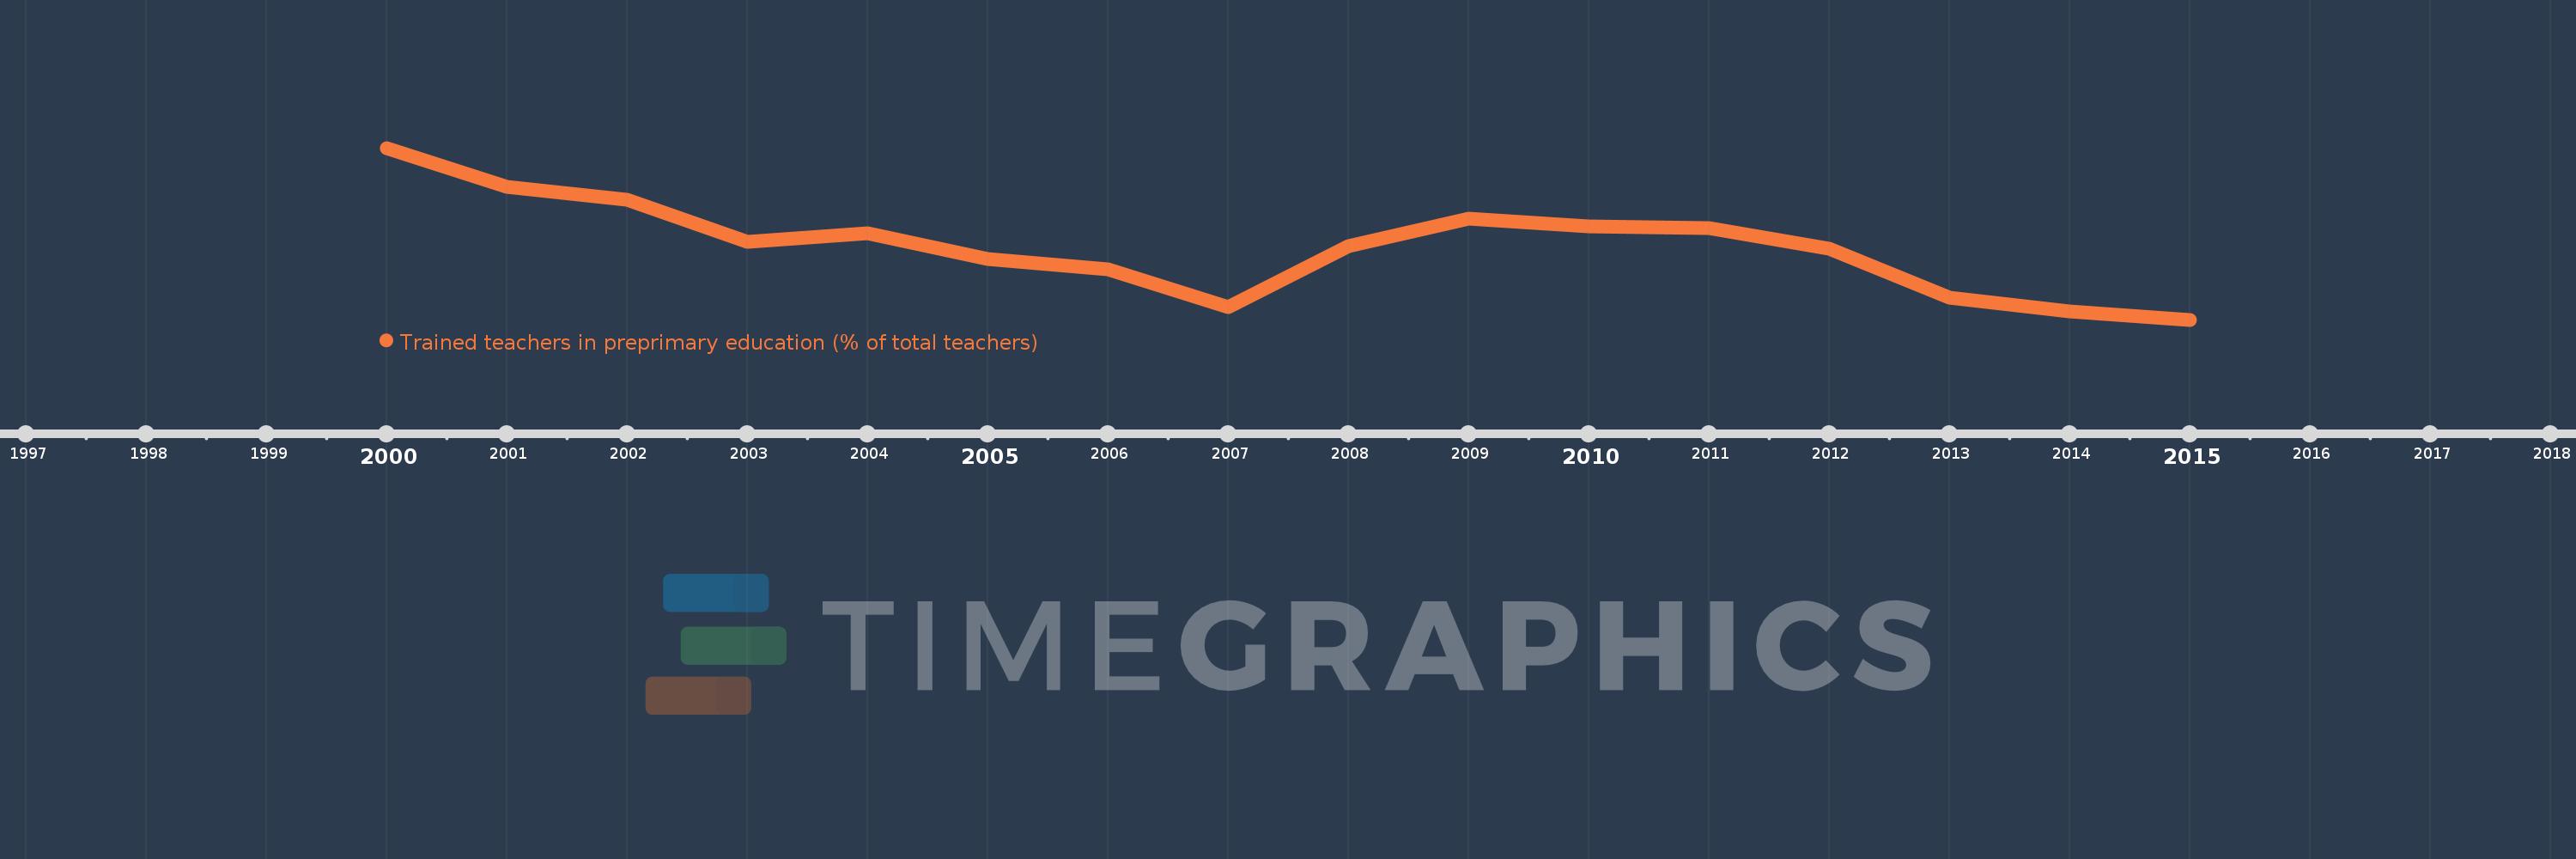
Cette échelle de temps montre un graphique de 2000 année à 2015 année Sub-Saharan Africa . Les données jusqu'à 1999 année ne sont pas présentés. Quantité d'observations actuelles selon dates: 16.

Source (désignation):

Les indicateurs du développement mondiale

Source (organisation):

United Nations Educational, Scientific, and Cultural Organization (UNESCO) Institute for Statistics.

Catégories:

Education

Dernière mise à jour

23 avr. 2017

Les indicateurs de changement de valeurs selon les années

En moyenne:
52.114
Minimum:
45.664
1 janv. 2015
Maximum:
60.75
1 janv. 2000
Pour la date d''observation
Valeur
Changement absolu
Le changement par rapport à la valeur précédente
1 janv. 2000
60.75
+60.75
0.0%
1 janv. 2001
57.305
-3.445
-5.67%
1 janv. 2002
56.225
-1.079
-1.88%
1 janv. 2003
52.488
-3.737
-6.65%
1 janv. 2004
53.233
+0.745
1.42%
1 janv. 2005
50.978
-2.256
-4.24%
1 janv. 2006
50.125
-0.852
-1.67%
1 janv. 2007
46.801
-3.324
-6.63%
1 janv. 2008
52.164
+5.363
11.46%
1 janv. 2009
54.519
+2.356
4.52%
1 janv. 2010
53.878
-0.641
-1.18%
1 janv. 2011
53.736
-0.142
-0.26%
1 janv. 2012
51.933
-1.803
-3.36%
1 janv. 2013
47.604
-4.329
-8.34%
1 janv. 2014
46.427
-1.176
-2.47%
1 janv. 2015
45.664
-0.764
-1.64%

Classement des pays selon les statistiques actuelles par années