29
/fr/
fr
AIzaSyAYiBZKx7MnpbEhh9jyipgxe19OcubqV5w
April 1, 2024
59165
Sub-Saharan Africa
SSF
false
2
1
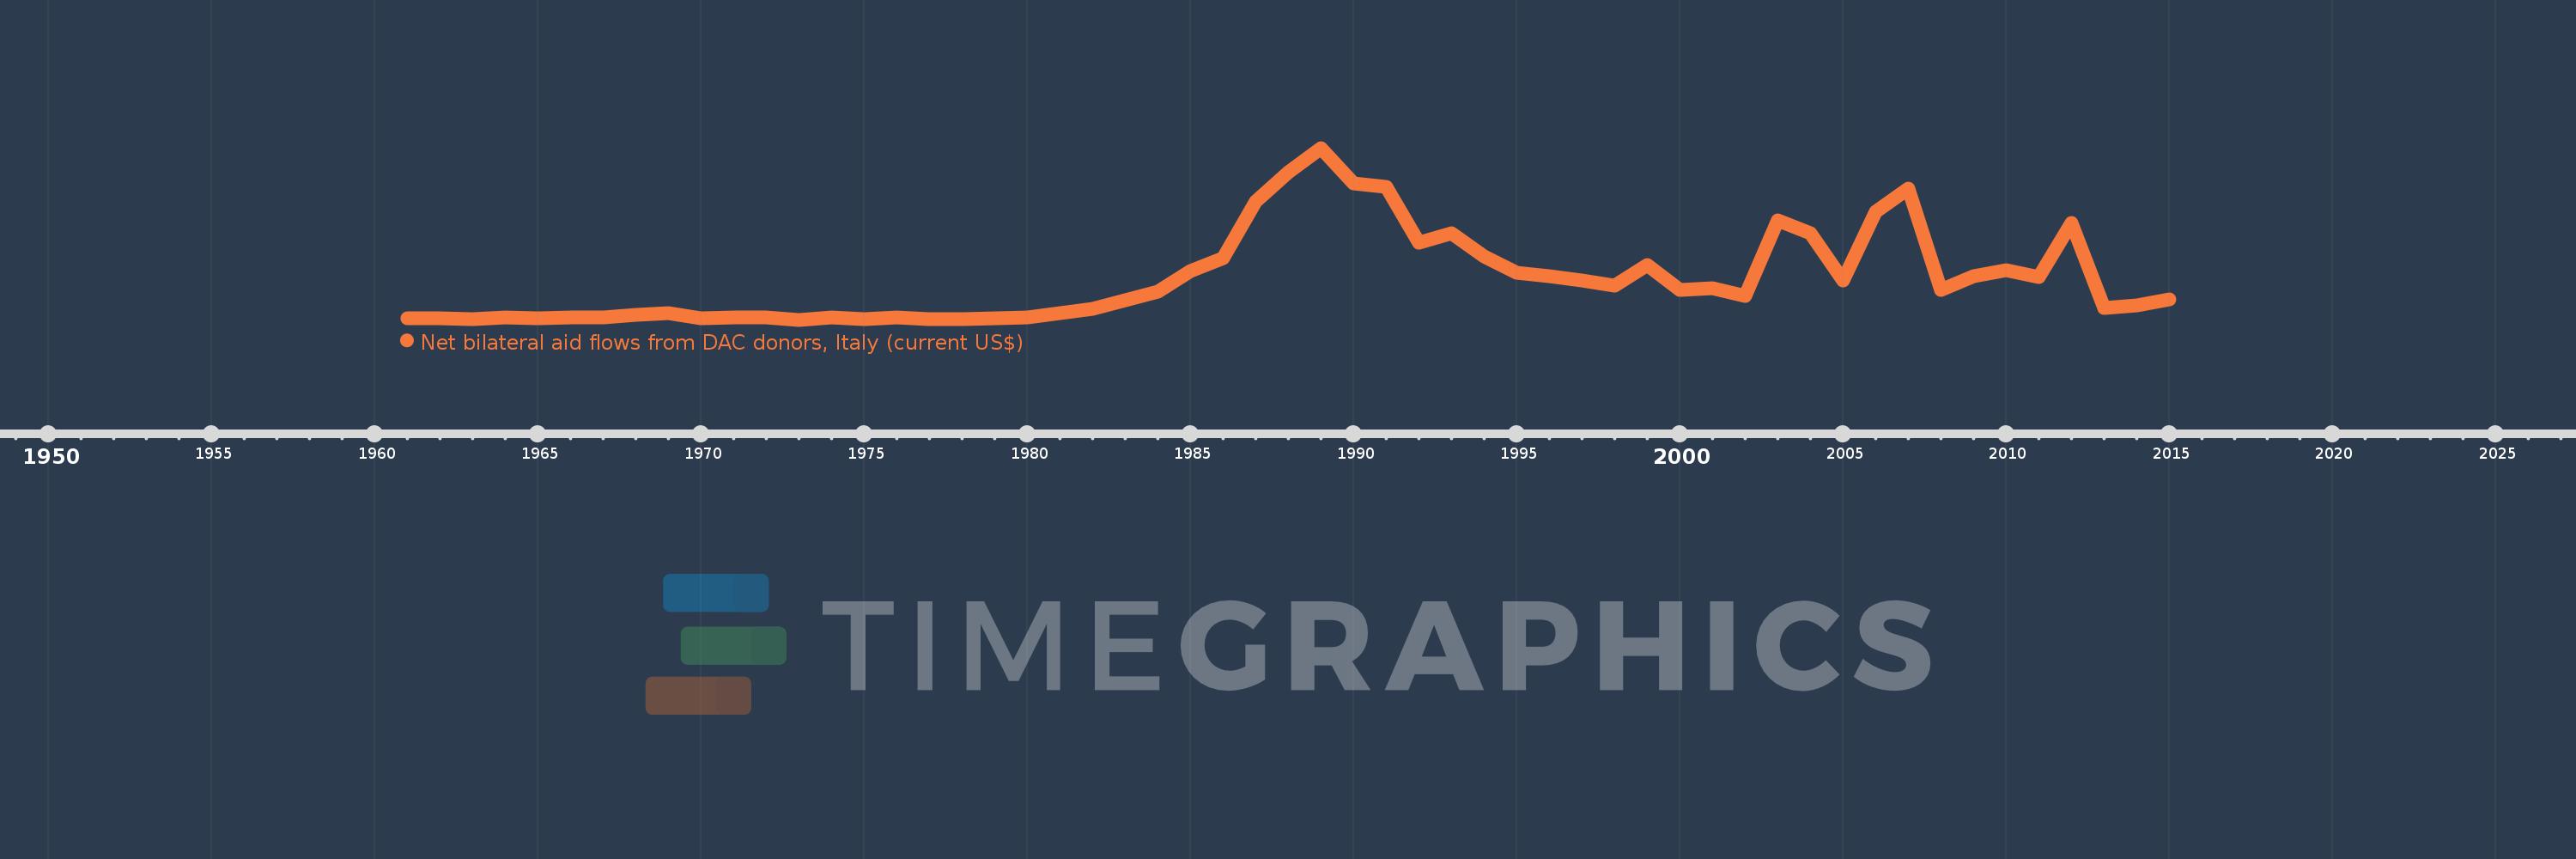
Net bilateral aid flows from DAC donors, Italy (current US$)
2015,2014,2013,2012,2011,2010,2009,2008,2007,2006,2005,2004,2003,2002,2001,2000,1999,1998,1997,1996,1995,1994,1993,1992,1991,1990,1989,1988,1987,1986,1985,1984,1983,1982,1981,1980,1979,1978,1977,1976,1975,1974,1973,1972,1971,1970,1969,1968,1967,1966,1965,1964,1963,1962,1961
Cette statistique dans les autres pays:
AfghanistanAlbaniaAlgeriaAngolaAntigua and BarbudaArab WorldArgentinaArmeniaAzerbaijanBahamas, TheBangladeshBarbadosBelarusBelizeBeninBhutanBoliviaBosnia and HerzegovinaBotswanaBrazilBulgariaBurkina FasoBurundiCabo VerdeCambodiaCameroonCaribbean small statesCentral African RepublicCentral Europe and the BalticsChadChileChinaColombiaComorosCongo, Dem. Rep.Congo, Rep.Costa RicaCote d'IvoireCroatiaCubaCyprusCzech RepublicDjiboutiDominicaDominican RepublicEast Asia & PacificEast Asia & Pacific (excluding high income)East Asia & Pacific (IDA & IBRD countries)EcuadorEgypt, Arab Rep.El SalvadorEquatorial GuineaEritreaEstoniaEthiopiaEuro areaEurope & Central AsiaEurope & Central Asia (excluding high income)Europe & Central Asia (IDA & IBRD countries)European UnionFijiFragile and conflict affected situationsGabonGambia, TheGeorgiaGhanaGuatemalaGuineaGuinea-BissauGuyanaHaitiHeavily indebted poor countries (HIPC)High incomeHondurasHong Kong SAR, ChinaHungaryIBRD onlyIDA & IBRD totalIDA blendIDA onlyIDA totalIndiaIndonesiaIran, Islamic Rep.IraqIsraelJamaicaJordanKazakhstanKenyaKiribatiKorea, Dem. People’s Rep.Korea, Rep.KosovoKuwaitKyrgyz RepublicLao PDRLatin America & Caribbean Latin America & Caribbean (excluding high income)Latin America & the Caribbean (IDA & IBRD countries)LatviaLeast developed countries: UN classificationLebanonLesothoLiberiaLibyaLithuaniaLow & middle incomeLow incomeLower middle incomeMacedonia, FYRMadagascarMalawiMalaysiaMaldivesMaliMaltaMarshall IslandsMauritaniaMauritiusMexicoMiddle East & North AfricaMiddle East & North Africa (excluding high income)Middle East & North Africa (IDA & IBRD countries)Middle incomeMoldovaMongoliaMontenegroMoroccoMozambiqueMyanmarNamibiaNauruNepalNicaraguaNigerNigeriaOECD membersOmanOther small statesPacific island small statesPakistanPalauPanamaPapua New GuineaParaguayPeruPhilippinesPolandRomaniaRussian FederationRwandaSamoaSao Tome and PrincipeSaudi ArabiaSenegalSerbiaSeychellesSierra LeoneSingaporeSlovak RepublicSloveniaSmall statesSolomon IslandsSomaliaSouth AfricaSouth AsiaSouth Asia (IDA & IBRD)South SudanSri LankaSt. Kitts and NevisSt. LuciaSt. Vincent and the GrenadinesSub-Saharan Africa Sub-Saharan Africa (excluding high income)Sub-Saharan Africa (IDA & IBRD countries)SudanSurinameSwazilandSyrian Arab RepublicTajikistanTanzaniaThailandTimor-LesteTogoTongaTrinidad and TobagoTunisiaTurkeyTurkmenistanTuvaluUgandaUkraineUnited Arab EmiratesUpper middle incomeUruguayUzbekistanVanuatuVenezuela, RBVietnamWest Bank and GazaWorldYemen, Rep.ZambiaZimbabwe La ligne de temps
Cette échelle de temps montre un graphique de 1961 année à 2015 année Sub-Saharan Africa . Les données jusqu'à 1960 année ne sont pas présentés. Quantité d'observations actuelles selon dates: 55.
Source (désignation):
Les indicateurs du développement mondiale
Source (organisation):
Development Assistance Committee of the Organisation for Economic Co-operation and Development, Geographical Distribution of Financial Flows to Developing Countries, Development Co-operation Report, and International Development Statistics database. Data are available online at: www.oecd.org/dac/stats/idsonline.
Catégories:
Aid Effectiveness
Dernière mise à jour
23 avr. 2017
Les indicateurs de changement de valeurs selon les années
Minimum:
6.67 mln.
1 janv. 1973
Maximum:
1.381 mds
1 janv. 1989
Pour la date d''observation
Valeur
Changement absolu
Le changement par rapport à la valeur précédente
1 janv. 1961
16.64 mln.
+16.64 mln.
0.0%
1 janv. 1962
18.5 mln.
+1.86 mln.
11.18%
1 janv. 1963
12.53 mln.
-5.97 mln.
-32.27%
1 janv. 1964
22.48 mln.
+9.95 mln.
79.41%
1 janv. 1965
16.4 mln.
-6.08 mln.
-27.05%
1 janv. 1966
26.76 mln.
+10.36 mln.
63.17%
1 janv. 1967
24.92 mln.
-1.84 mln.
-6.88%
1 janv. 1968
45.2 mln.
+20.28 mln.
81.38%
1 janv. 1969
56.2 mln.
+11.0 mln.
24.34%
1 janv. 1970
16.23 mln.
-39.97 mln.
-71.12%
1 janv. 1971
24.54 mln.
+8.31 mln.
51.2%
1 janv. 1972
27.0 mln.
+2.46 mln.
10.02%
1 janv. 1973
6.67 mln.
-20.33 mln.
-75.3%
1 janv. 1974
22.74 mln.
+16.07 mln.
240.93%
1 janv. 1975
12.82 mln.
-9.92 mln.
-43.62%
1 janv. 1976
25.86 mln.
+13.04 mln.
101.72%
1 janv. 1977
11.33 mln.
-14.53 mln.
-56.19%
1 janv. 1978
13.49 mln.
+2.16 mln.
19.06%
1 janv. 1979
17.94 mln.
+4.45 mln.
32.99%
1 janv. 1980
23.39 mln.
+5.45 mln.
30.38%
1 janv. 1981
57.05 mln.
+33.66 mln.
143.91%
1 janv. 1982
90.85 mln.
+33.8 mln.
59.25%
1 janv. 1983
161.17 mln.
+70.32 mln.
77.4%
1 janv. 1984
233.9 mln.
+72.73 mln.
45.13%
1 janv. 1985
396.99 mln.
+163.09 mln.
69.73%
1 janv. 1986
499.4 mln.
+102.41 mln.
25.8%
1 janv. 1987
953.48 mln.
+454.08 mln.
90.93%
1 janv. 1988
1.187 mds
+233.19 mln.
24.46%
1 janv. 1989
1.381 mds
+193.84 mln.
16.33%
1 janv. 1990
1.094 mds
-286.27 mln.
-20.74%
1 janv. 1991
1.072 mds
-21.91 mln.
-2.0%
1 janv. 1992
624.52 mln.
-447.81 mln.
-41.76%
1 janv. 1993
695.46 mln.
+70.94 mln.
11.36%
1 janv. 1994
513.65 mln.
-181.81 mln.
-26.14%
1 janv. 1995
381.92 mln.
-131.73 mln.
-25.65%
1 janv. 1996
354.62 mln.
-27.3 mln.
-7.15%
1 janv. 1997
318.98 mln.
-35.64 mln.
-10.05%
1 janv. 1998
276.92 mln.
-42.06 mln.
-13.19%
1 janv. 1999
442.56 mln.
+165.64 mln.
59.82%
1 janv. 2000
244.81 mln.
-197.75 mln.
-44.68%
1 janv. 2001
257.49 mln.
+12.68 mln.
5.18%
1 janv. 2002
194.9 mln.
-62.59 mln.
-24.31%
1 janv. 2003
802.36 mln.
+607.46 mln.
311.68%
1 janv. 2004
696.18 mln.
-106.18 mln.
-13.23%
1 janv. 2005
319.78 mln.
-376.4 mln.
-54.07%
1 janv. 2006
872.69 mln.
+552.91 mln.
172.9%
1 janv. 2007
1.055 mds
+182.37 mln.
20.9%
1 janv. 2008
243.2 mln.
-811.86 mln.
-76.95%
1 janv. 2009
357.0 mln.
+113.8 mln.
46.79%
1 janv. 2010
404.07 mln.
+47.07 mln.
13.18%
1 janv. 2011
344.66 mln.
-59.41 mln.
-14.7%
1 janv. 2012
783.22 mln.
+438.56 mln.
127.24%
1 janv. 2013
103.55 mln.
-679.67 mln.
-86.78%
1 janv. 2014
118.08 mln.
+14.53 mln.
14.03%
1 janv. 2015
166.88 mln.
+48.8 mln.
41.33%
Classement des pays selon les statistiques actuelles par années


Commentaires: