30
/fr/
AIzaSyAYiBZKx7MnpbEhh9jyipgxe19OcubqV5w
April 1, 2024
57984
South Asia (IDA & IBRD)
TSA
false
2
1
Diarrhea treatment (% of children under 5 who received ORS packet)
2007,2000,1994,1990,1988,1987
Download
Bibliothèque de statistiques globales →South Asia (IDA & IBRD) →

Diarrhea treatment (% of children under 5 who received ORS packet)

Cette statistique dans les autres pays:

AfghanistanAlbaniaAlgeriaAngolaArab WorldArgentinaArmeniaAzerbaijanBahrainBangladeshBarbadosBelarusBelizeBeninBhutanBoliviaBosnia and HerzegovinaBotswanaBrazilBrunei DarussalamBurkina FasoBurundiCabo VerdeCambodiaCameroonCaribbean small statesCentral African RepublicChadChileChinaColombiaComorosCongo, Dem. Rep.Congo, Rep.Costa RicaCote d'IvoireCroatiaCubaCyprusDjiboutiDominican RepublicEarly-demographic dividendEast Asia & PacificEast Asia & Pacific (excluding high income)East Asia & Pacific (IDA & IBRD countries)EcuadorEgypt, Arab Rep.El SalvadorEquatorial GuineaEritreaEthiopiaFijiFragile and conflict affected situationsGabonGambia, TheGeorgiaGhanaGrenadaGuatemalaGuineaGuinea-BissauGuyanaHaitiHeavily indebted poor countries (HIPC)HondurasIBRD onlyIDA & IBRD totalIDA blendIDA onlyIDA totalIndiaIndonesiaIran, Islamic Rep.IraqJamaicaJordanKazakhstanKenyaKiribatiKorea, Dem. People’s Rep.KuwaitKyrgyz RepublicLao PDRLate-demographic dividendLatin America & Caribbean Latin America & Caribbean (excluding high income)Latin America & the Caribbean (IDA & IBRD countries)Least developed countries: UN classificationLebanonLesothoLiberiaLibyaLow & middle incomeLow incomeLower middle incomeMacedonia, FYRMadagascarMalawiMalaysiaMaldivesMaliMarshall IslandsMauritaniaMauritiusMexicoMiddle East & North AfricaMiddle East & North Africa (excluding high income)Middle East & North Africa (IDA & IBRD countries)Middle incomeMoldovaMongoliaMontenegroMoroccoMozambiqueMyanmarNamibiaNauruNepalNicaraguaNigerNigeriaOmanOther small statesPacific island small statesPakistanPanamaPapua New GuineaParaguayPeruPhilippinesPre-demographic dividendQatarRwandaSamoaSao Tome and PrincipeSaudi ArabiaSenegalSerbiaSeychellesSierra LeoneSmall statesSolomon IslandsSomaliaSouth AfricaSouth AsiaSouth Asia (IDA & IBRD)South SudanSri LankaSt. Kitts and NevisSt. LuciaSt. Vincent and the GrenadinesSub-Saharan Africa Sub-Saharan Africa (excluding high income)Sub-Saharan Africa (IDA & IBRD countries)SudanSurinameSwazilandSyrian Arab RepublicTajikistanTanzaniaThailandTimor-LesteTogoTongaTrinidad and TobagoTunisiaTurkeyTurkmenistanTuvaluUgandaUkraineUnited Arab EmiratesUpper middle incomeUruguayUzbekistanVanuatuVenezuela, RBVietnamWest Bank and GazaWorldYemen, Rep.ZambiaZimbabwe

La ligne de temps

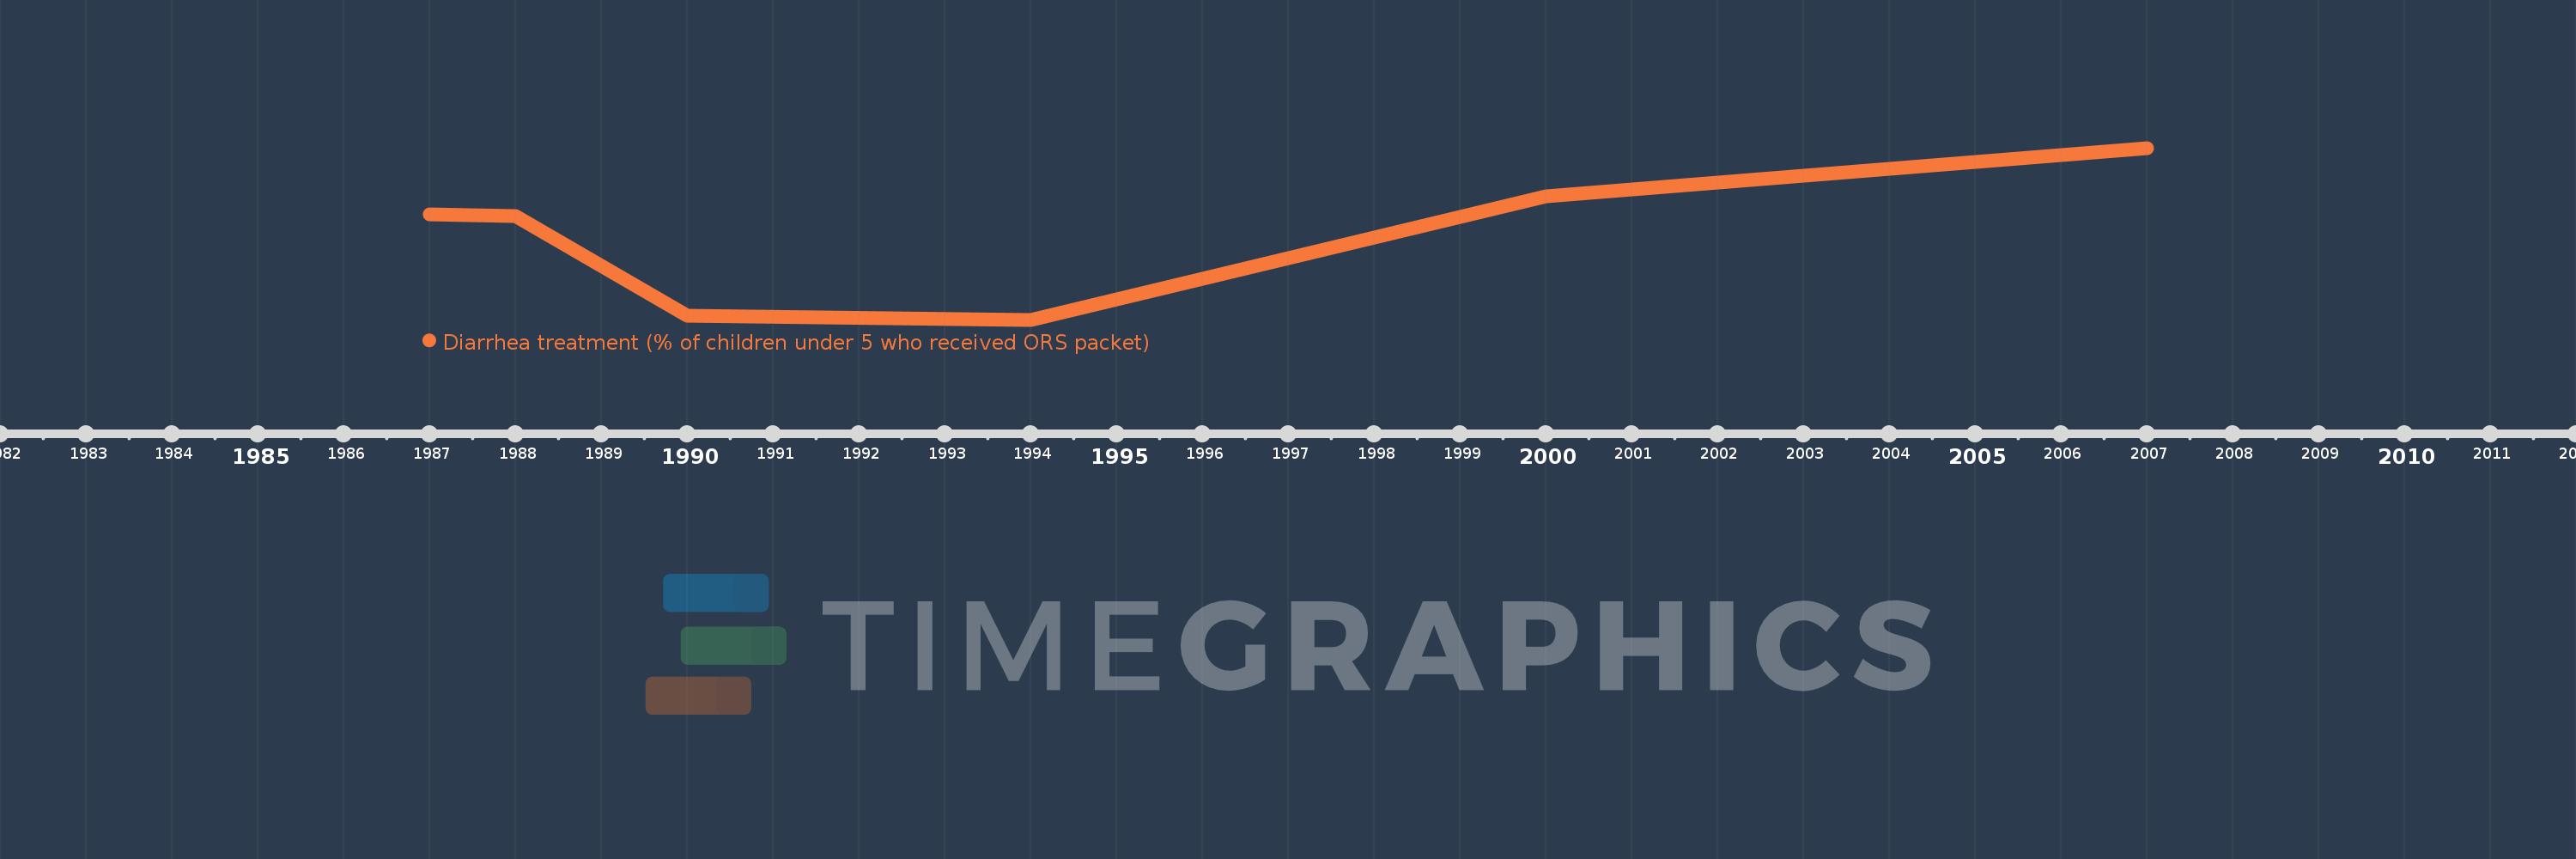
Cette échelle de temps montre un graphique de 1987 année à 2007 année South Asia (IDA & IBRD). Les données jusqu'à 1986 année ne sont pas présentés. Quantité d'observations actuelles selon dates: 6.

Source (désignation):

Les indicateurs du développement mondiale

Source (organisation):

UNICEF, State of the World's Children, Childinfo, and Demographic and Health Surveys.

Catégories:

Health

Dernière mise à jour

23 avr. 2017

Les indicateurs de changement de valeurs selon les années

En moyenne:
23.949
Minimum:
17.73
1 janv. 1994
Maximum:
30.327
1 janv. 2007
Pour la date d''observation
Valeur
Changement absolu
Le changement par rapport à la valeur précédente
1 janv. 1987
25.45
+25.45
0.0%
1 janv. 1988
25.354
-0.096
-0.38%
1 janv. 1990
18.03
-7.324
-28.89%
1 janv. 1994
17.73
-0.3
-1.66%
1 janv. 2000
26.8
+9.07
51.15%
1 janv. 2007
30.327
+3.527
13.16%

Classement des pays selon les statistiques actuelles par années