29
/fr/
fr
AIzaSyAYiBZKx7MnpbEhh9jyipgxe19OcubqV5w
April 1, 2024
57265
South Asia
SAS
false
2
1
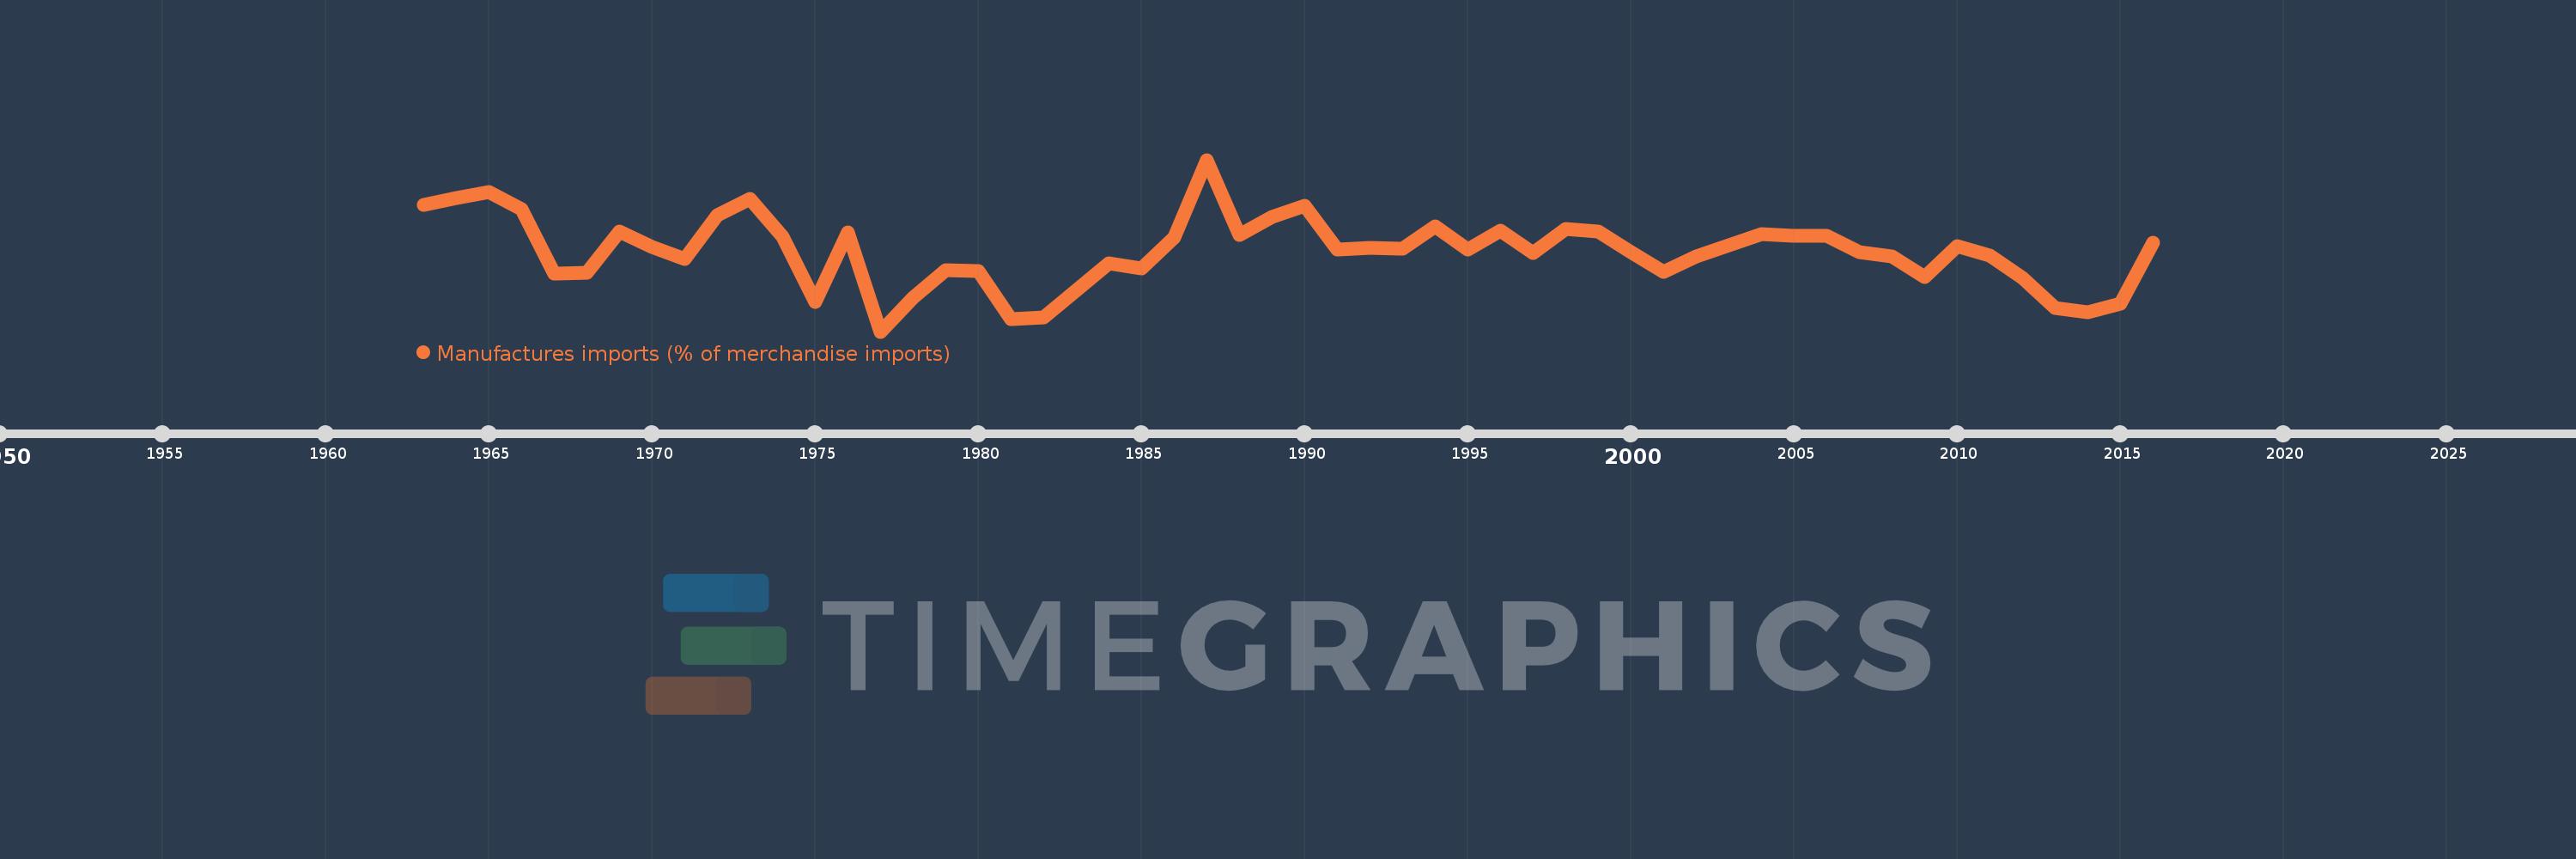
Manufactures imports (% of merchandise imports)
2016,2015,2014,2013,2012,2011,2010,2009,2008,2007,2006,2005,2004,2003,2002,2001,2000,1999,1998,1997,1996,1995,1994,1993,1992,1991,1990,1989,1988,1987,1986,1985,1984,1982,1981,1980,1979,1978,1977,1976,1975,1974,1973,1972,1971,1970,1969,1968,1967,1966,1965,1964,1963
Cette statistique dans les autres pays:
AfghanistanAlbaniaAlgeriaAndorraAngolaAntigua and BarbudaArab WorldArgentinaArmeniaArubaAustraliaAustriaAzerbaijanBahamas, TheBahrainBangladeshBarbadosBelarusBelgiumBelizeBeninBermudaBhutanBoliviaBosnia and HerzegovinaBotswanaBrazilBrunei DarussalamBulgariaBurkina FasoBurundiCabo VerdeCambodiaCameroonCanadaCaribbean small statesCayman IslandsCentral African RepublicCentral Europe and the BalticsChadChileChinaColombiaComorosCongo, Dem. Rep.Congo, Rep.Costa RicaCote d'IvoireCroatiaCubaCyprusCzech RepublicDenmarkDjiboutiDominicaDominican RepublicEarly-demographic dividendEast Asia & PacificEast Asia & Pacific (excluding high income)East Asia & Pacific (IDA & IBRD countries)EcuadorEgypt, Arab Rep.El SalvadorEquatorial GuineaEritreaEstoniaEthiopiaEuro areaEurope & Central AsiaEurope & Central Asia (excluding high income)Europe & Central Asia (IDA & IBRD countries)European UnionFaroe IslandsFijiFinlandFragile and conflict affected situationsFranceFrench PolynesiaGabonGambia, TheGeorgiaGermanyGhanaGreeceGreenlandGrenadaGuatemalaGuineaGuinea-BissauGuyanaHaitiHeavily indebted poor countries (HIPC)High incomeHondurasHong Kong SAR, ChinaHungaryIBRD onlyIcelandIDA & IBRD totalIDA blendIDA onlyIDA totalIndiaIndonesiaIran, Islamic Rep.IraqIrelandIsraelItalyJamaicaJapanJordanKazakhstanKenyaKiribatiKorea, Rep.KuwaitKyrgyz RepublicLao PDRLate-demographic dividendLatin America & Caribbean Latin America & Caribbean (excluding high income)Latin America & the Caribbean (IDA & IBRD countries)LatviaLeast developed countries: UN classificationLebanonLesothoLiberiaLibyaLithuaniaLow & middle incomeLow incomeLower middle incomeLuxembourgMacao SAR, ChinaMacedonia, FYRMadagascarMalawiMalaysiaMaldivesMaliMaltaMauritaniaMauritiusMexicoMiddle East & North AfricaMiddle East & North Africa (excluding high income)Middle East & North Africa (IDA & IBRD countries)Middle incomeMoldovaMongoliaMoroccoMozambiqueMyanmarNamibiaNepalNetherlandsNew CaledoniaNew ZealandNicaraguaNigerNigeriaNorth AmericaNorwayOECD membersOmanOther small statesPacific island small statesPakistanPalauPanamaPapua New GuineaParaguayPeruPhilippinesPolandPortugalPost-demographic dividendPre-demographic dividendQatarRomaniaRussian FederationRwandaSamoaSao Tome and PrincipeSaudi ArabiaSenegalSerbiaSeychellesSierra LeoneSingaporeSlovak RepublicSloveniaSmall statesSolomon IslandsSomaliaSouth AfricaSouth AsiaSouth Asia (IDA & IBRD)SpainSri LankaSt. Kitts and NevisSt. LuciaSt. Vincent and the GrenadinesSub-Saharan Africa Sub-Saharan Africa (excluding high income)Sub-Saharan Africa (IDA & IBRD countries)SudanSurinameSwazilandSwedenSwitzerlandSyrian Arab RepublicTajikistanTanzaniaThailandTimor-LesteTogoTongaTrinidad and TobagoTunisiaTurkeyTurkmenistanTurks and Caicos IslandsTuvaluUgandaUkraineUnited Arab EmiratesUnited KingdomUnited StatesUpper middle incomeUruguayVanuatuVenezuela, RBVietnamVirgin Islands (U.S.)WorldYemen, Rep.ZambiaZimbabwe La ligne de temps
Cette échelle de temps montre un graphique de 1963 année à 2016 année South Asia. Les données jusqu'à 1962 année ne sont pas présentés. Quantité d'observations actuelles selon dates: 53.
Source (désignation):
Les indicateurs du développement mondiale
Source (organisation):
World Bank staff estimates from the Comtrade database maintained by the United Nations Statistics Division.
Catégories:
Private Sector, Trade
Dernière mise à jour
23 avr. 2017
Les indicateurs de changement de valeurs selon les années
Minimum:
40.295
1 janv. 1977
Maximum:
65.465
1 janv. 1987
Pour la date d''observation
Valeur
Changement absolu
Le changement par rapport à la valeur précédente
1 janv. 1963
58.844
+58.844
0.0%
1 janv. 1964
59.851
+1.008
1.71%
1 janv. 1965
60.684
+0.832
1.39%
1 janv. 1966
58.173
-2.51
-4.14%
1 janv. 1967
48.77
-9.403
-16.16%
1 janv. 1968
48.879
+0.109
0.22%
1 janv. 1969
54.983
+6.104
12.49%
1 janv. 1970
52.63
-2.353
-4.28%
1 janv. 1971
50.946
-1.684
-3.2%
1 janv. 1972
57.29
+6.344
12.45%
1 janv. 1973
59.764
+2.474
4.32%
1 janv. 1974
54.239
-5.525
-9.24%
1 janv. 1975
44.619
-9.62
-17.74%
1 janv. 1976
54.816
+10.197
22.85%
1 janv. 1977
40.295
-14.521
-26.49%
1 janv. 1978
45.236
+4.941
12.26%
1 janv. 1979
49.275
+4.039
8.93%
1 janv. 1980
49.13
-0.145
-0.29%
1 janv. 1981
42.082
-7.048
-14.34%
1 janv. 1982
42.336
+0.254
0.6%
1 janv. 1984
50.25
+7.914
18.69%
1 janv. 1985
49.56
-0.69
-1.37%
1 janv. 1986
54.035
+4.475
9.03%
1 janv. 1987
65.465
+11.43
21.15%
1 janv. 1988
54.392
-11.073
-16.91%
1 janv. 1989
57.14
+2.747
5.05%
1 janv. 1990
58.756
+1.616
2.83%
1 janv. 1991
52.37
-6.385
-10.87%
1 janv. 1992
52.615
+0.244
0.47%
1 janv. 1993
52.429
-0.186
-0.35%
1 janv. 1994
55.718
+3.289
6.27%
1 janv. 1995
52.361
-3.357
-6.03%
1 janv. 1996
55.034
+2.673
5.11%
1 janv. 1997
51.87
-3.163
-5.75%
1 janv. 1998
55.302
+3.432
6.62%
1 janv. 1999
55.019
-0.283
-0.51%
1 janv. 2000
51.953
-3.066
-5.57%
1 janv. 2001
49.025
-2.927
-5.63%
1 janv. 2002
51.302
+2.277
4.64%
1 janv. 2003
53.001
+1.699
3.31%
1 janv. 2004
54.535
+1.535
2.9%
1 janv. 2005
54.334
-0.201
-0.37%
1 janv. 2006
54.304
-0.031
-0.06%
1 janv. 2007
51.913
-2.391
-4.4%
1 janv. 2008
51.353
-0.56
-1.08%
1 janv. 2009
48.34
-3.013
-5.87%
1 janv. 2010
52.861
+4.521
9.35%
1 janv. 2011
51.444
-1.417
-2.68%
1 janv. 2012
48.13
-3.314
-6.44%
1 janv. 2013
43.795
-4.335
-9.01%
1 janv. 2014
43.135
-0.66
-1.51%
1 janv. 2015
44.38
+1.245
2.89%
1 janv. 2016
53.274
+8.895
20.04%
Classement des pays selon les statistiques actuelles par années


Commentaires: