29
/fr/
fr
AIzaSyAYiBZKx7MnpbEhh9jyipgxe19OcubqV5w
April 1, 2024
56525
Small states
SST
false
2
1
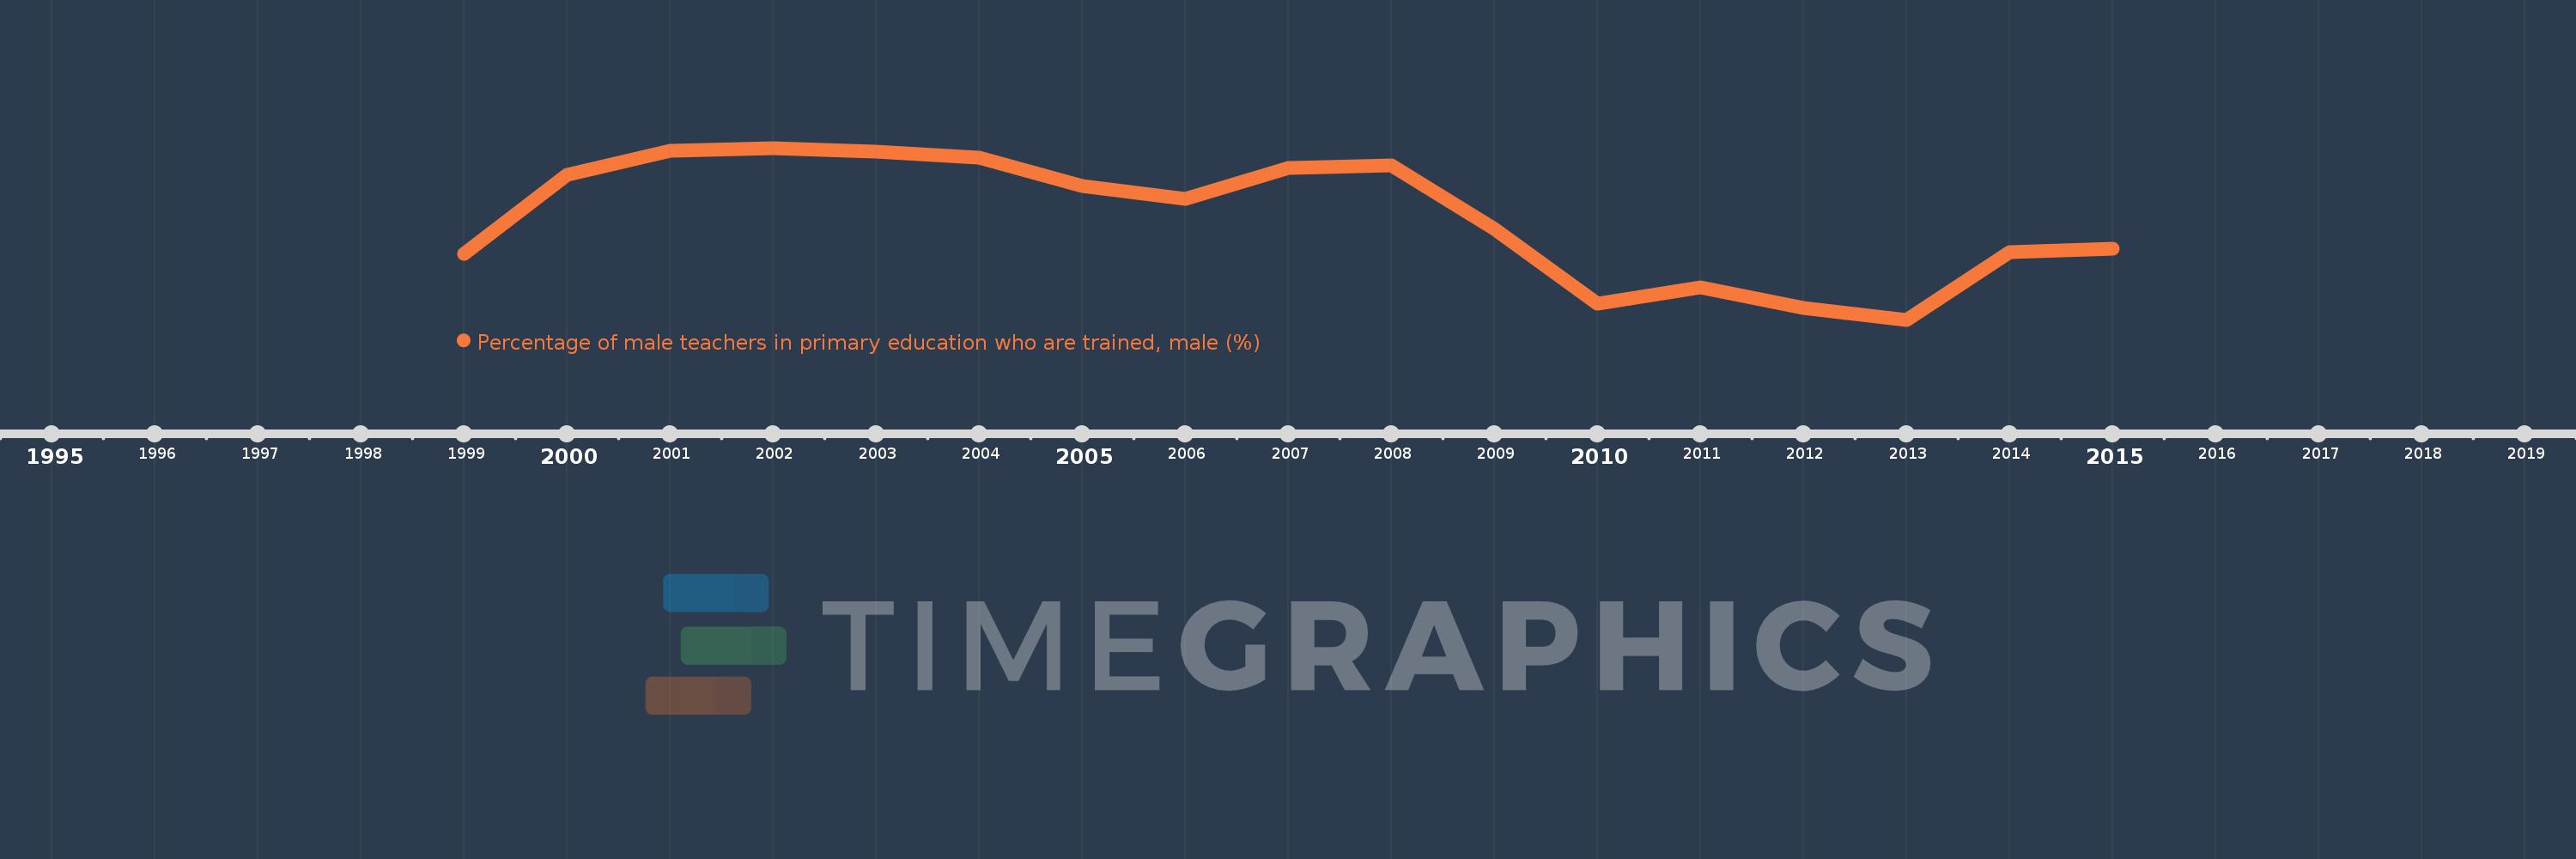
Percentage of male teachers in primary education who are trained, male (%)
2015,2014,2013,2012,2011,2010,2009,2008,2007,2006,2005,2004,2003,2002,2001,2000,1999
Cette statistique dans les autres pays:
La ligne de temps
Cette échelle de temps montre un graphique de 1999 année à 2015 année Small states. Les données jusqu'à 1998 année ne sont pas présentés. Quantité d'observations actuelles selon dates: 17.
Source (désignation):
Les indicateurs du développement mondiale
Source (organisation):
United Nations Educational, Scientific, and Cultural Organization (UNESCO) Institute for Statistics.
Catégories:
Education, Gender
Dernière mise à jour
23 avr. 2017
Les indicateurs de changement de valeurs selon les années
Minimum:
75.038
1 janv. 2013
Maximum:
79.612
1 janv. 2002
Pour la date d''observation
Valeur
Changement absolu
Le changement par rapport à la valeur précédente
1 janv. 1999
76.799
+76.799
0.0%
1 janv. 2000
78.886
+2.087
2.72%
1 janv. 2001
79.531
+0.645
0.82%
1 janv. 2002
79.612
+0.081
0.1%
1 janv. 2003
79.517
-0.096
-0.12%
1 janv. 2004
79.349
-0.168
-0.21%
1 janv. 2005
78.608
-0.741
-0.93%
1 janv. 2006
78.265
-0.343
-0.44%
1 janv. 2007
79.079
+0.814
1.04%
1 janv. 2008
79.141
+0.062
0.08%
1 janv. 2009
77.463
-1.678
-2.12%
1 janv. 2010
75.458
-2.005
-2.59%
1 janv. 2011
75.909
+0.451
0.6%
1 janv. 2012
75.352
-0.557
-0.73%
1 janv. 2013
75.038
-0.314
-0.42%
1 janv. 2014
76.838
+1.801
2.4%
1 janv. 2015
76.921
+0.082
0.11%
Classement des pays selon les statistiques actuelles par années


Commentaires: