29
/fr/
fr
AIzaSyAYiBZKx7MnpbEhh9jyipgxe19OcubqV5w
April 1, 2024
56440
Small states
SST
false
2
1
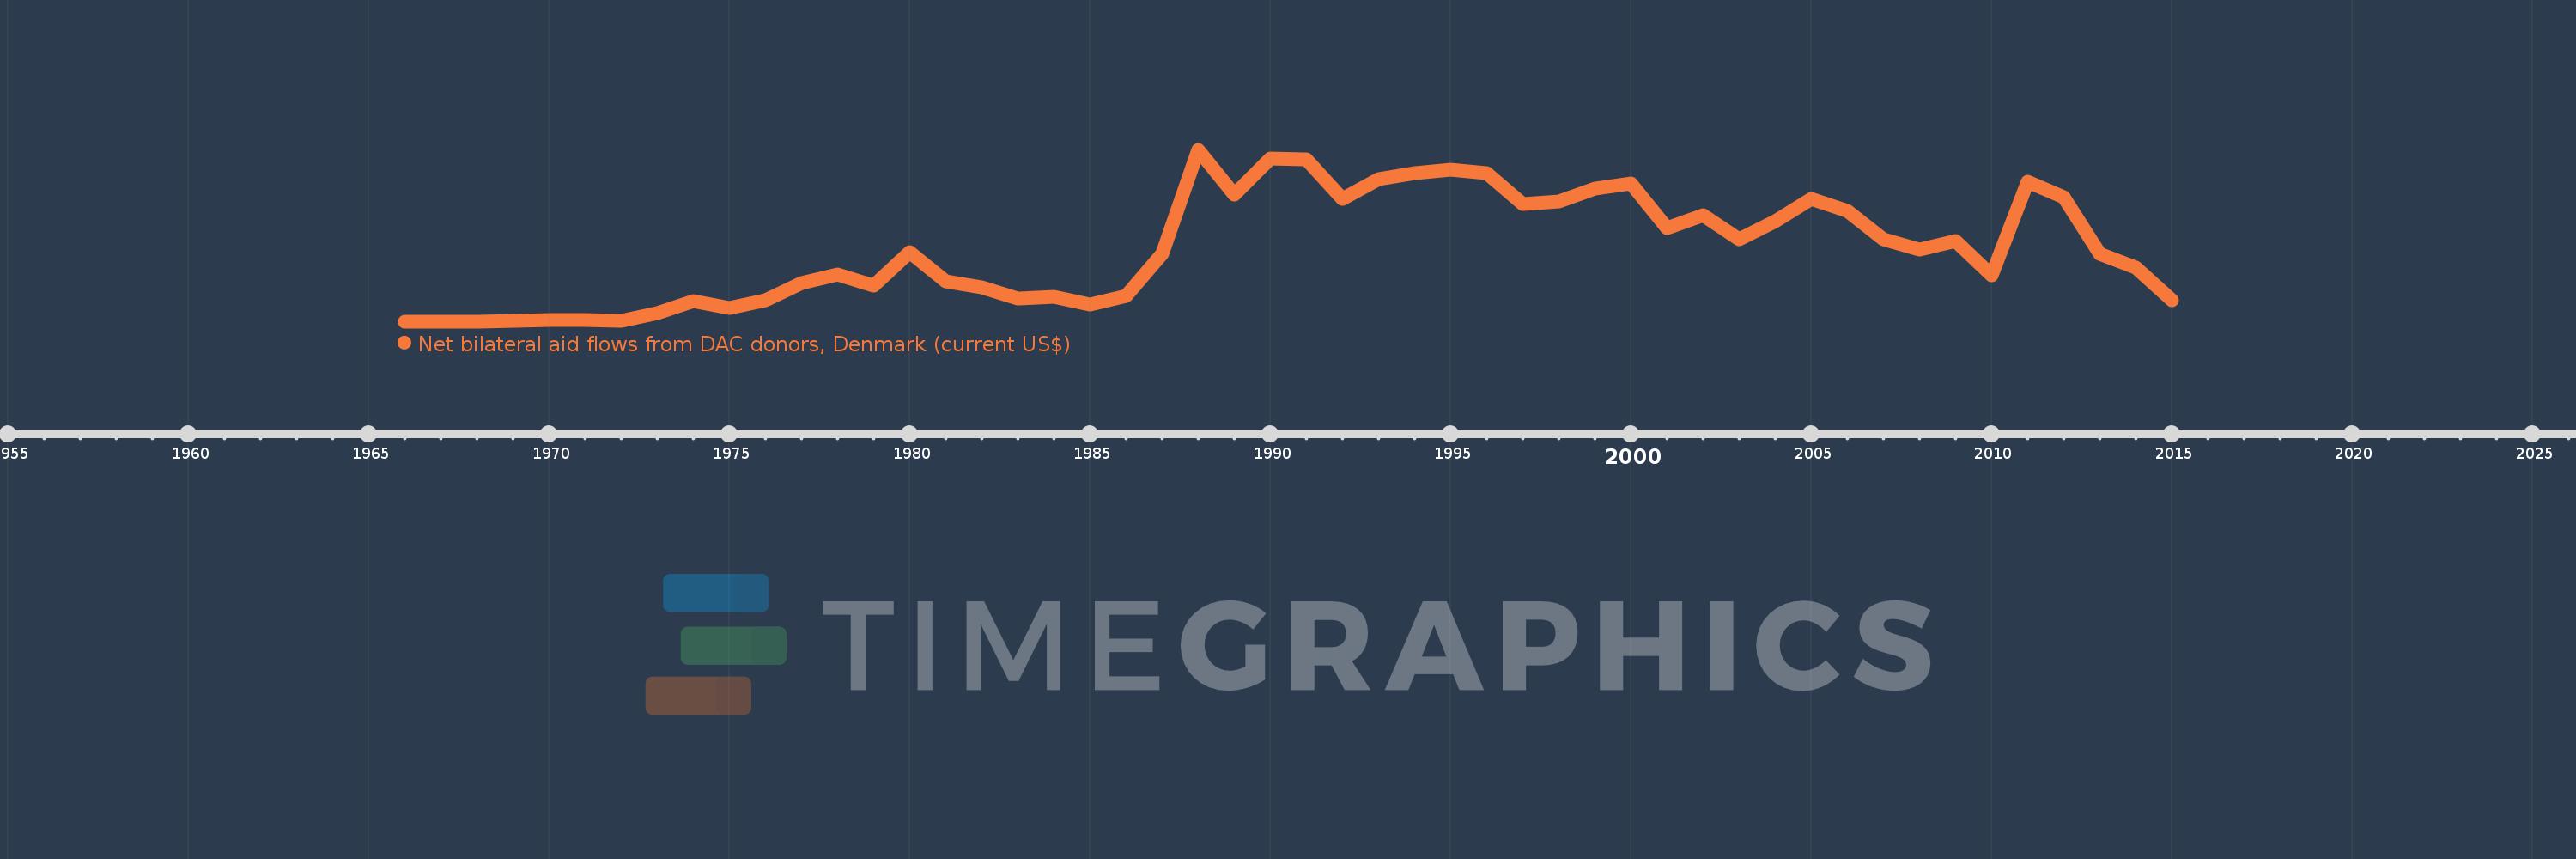
Net bilateral aid flows from DAC donors, Denmark (current US$)
2015,2014,2013,2012,2011,2010,2009,2008,2007,2006,2005,2004,2003,2002,2001,2000,1999,1998,1997,1996,1995,1994,1993,1992,1991,1990,1989,1988,1987,1986,1985,1984,1983,1982,1981,1980,1979,1978,1977,1976,1975,1974,1973,1972,1971,1970,1969,1968,1966
Cette statistique dans les autres pays:
AfghanistanAlbaniaAlgeriaAngolaArab WorldArgentinaArmeniaAzerbaijanBahrainBangladeshBelarusBelizeBeninBhutanBoliviaBosnia and HerzegovinaBotswanaBrazilBulgariaBurkina FasoBurundiCabo VerdeCambodiaCameroonCaribbean small statesCentral African RepublicCentral Europe and the BalticsChadChileChinaColombiaComorosCongo, Dem. Rep.Congo, Rep.Costa RicaCote d'IvoireCroatiaCubaCyprusCzech RepublicDjiboutiDominicaDominican RepublicEast Asia & PacificEast Asia & Pacific (excluding high income)East Asia & Pacific (IDA & IBRD countries)EcuadorEgypt, Arab Rep.El SalvadorEritreaEstoniaEthiopiaEuro areaEurope & Central AsiaEurope & Central Asia (excluding high income)Europe & Central Asia (IDA & IBRD countries)European UnionFijiFragile and conflict affected situationsGambia, TheGeorgiaGhanaGrenadaGuatemalaGuineaGuinea-BissauGuyanaHaitiHeavily indebted poor countries (HIPC)High incomeHondurasHungaryIBRD onlyIDA & IBRD totalIDA blendIDA onlyIDA totalIndiaIndonesiaIran, Islamic Rep.IraqIsraelJamaicaJordanKazakhstanKenyaKorea, Dem. People’s Rep.Korea, Rep.KosovoKuwaitKyrgyz RepublicLao PDRLatin America & Caribbean Latin America & Caribbean (excluding high income)Latin America & the Caribbean (IDA & IBRD countries)LatviaLeast developed countries: UN classificationLebanonLesothoLiberiaLibyaLithuaniaLow & middle incomeLow incomeLower middle incomeMacedonia, FYRMadagascarMalawiMalaysiaMaldivesMaliMaltaMauritaniaMauritiusMexicoMiddle East & North AfricaMiddle East & North Africa (excluding high income)Middle East & North Africa (IDA & IBRD countries)Middle incomeMoldovaMongoliaMontenegroMoroccoMozambiqueMyanmarNamibiaNepalNicaraguaNigerNigeriaOECD membersOmanOther small statesPacific island small statesPakistanPanamaPapua New GuineaParaguayPeruPhilippinesPolandRomaniaRussian FederationRwandaSamoaSenegalSerbiaSeychellesSierra LeoneSingaporeSlovak RepublicSloveniaSmall statesSolomon IslandsSomaliaSouth AfricaSouth AsiaSouth Asia (IDA & IBRD)South SudanSri LankaSub-Saharan Africa Sub-Saharan Africa (excluding high income)Sub-Saharan Africa (IDA & IBRD countries)SudanSwazilandSyrian Arab RepublicTajikistanTanzaniaThailandTimor-LesteTogoTongaTrinidad and TobagoTunisiaTurkeyTurkmenistanUgandaUkraineUpper middle incomeUruguayUzbekistanVanuatuVenezuela, RBVietnamWest Bank and GazaWorldYemen, Rep.ZambiaZimbabwe La ligne de temps
Cette échelle de temps montre un graphique de 1966 année à 2015 année Small states. Les données jusqu'à 1965 année ne sont pas présentés. Quantité d'observations actuelles selon dates: 49.
Source (désignation):
Les indicateurs du développement mondiale
Source (organisation):
Development Assistance Committee of the Organisation for Economic Co-operation and Development, Geographical Distribution of Financial Flows to Developing Countries, Development Co-operation Report, and International Development Statistics database. Data are available online at: www.oecd.org/dac/stats/idsonline.
Catégories:
Aid Effectiveness
Dernière mise à jour
23 avr. 2017
Les indicateurs de changement de valeurs selon les années
Minimum:
20.0 milles
1 janv. 1966
Maximum:
32.42 mln.
1 janv. 1988
Pour la date d''observation
Valeur
Changement absolu
Le changement par rapport à la valeur précédente
1 janv. 1966
20.0 milles
+20.0 milles
0.0%
1 janv. 1968
80.0 milles
+60.0 milles
300.0%
1 janv. 1969
240.0 milles
+160.0 milles
200.0%
1 janv. 1970
380.0 milles
+140.0 milles
58.33%
1 janv. 1971
400.0 milles
+20.0 milles
5.26%
1 janv. 1972
280.0 milles
-120.0 milles
-30.0%
1 janv. 1973
1.66 mln.
+1.38 mln.
492.86%
1 janv. 1974
3.95 mln.
+2.29 mln.
137.95%
1 janv. 1975
2.74 mln.
-1.21 mln.
-30.63%
1 janv. 1976
4.16 mln.
+1.42 mln.
51.82%
1 janv. 1977
7.31 mln.
+3.15 mln.
75.72%
1 janv. 1978
9.03 mln.
+1.72 mln.
23.53%
1 janv. 1979
6.9 mln.
-2.13 mln.
-23.59%
1 janv. 1980
13.19 mln.
+6.29 mln.
91.16%
1 janv. 1981
7.75 mln.
-5.44 mln.
-41.24%
1 janv. 1982
6.61 mln.
-1.14 mln.
-14.71%
1 janv. 1983
4.43 mln.
-2.18 mln.
-32.98%
1 janv. 1984
4.81 mln.
+380.0 milles
8.58%
1 janv. 1985
3.26 mln.
-1.55 mln.
-32.22%
1 janv. 1986
4.97 mln.
+1.71 mln.
52.45%
1 janv. 1987
12.81 mln.
+7.84 mln.
157.75%
1 janv. 1988
32.42 mln.
+19.61 mln.
153.08%
1 janv. 1989
23.97 mln.
-8.45 mln.
-26.06%
1 janv. 1990
30.88 mln.
+6.91 mln.
28.83%
1 janv. 1991
30.61 mln.
-270.0 milles
-0.87%
1 janv. 1992
23.3 mln.
-7.31 mln.
-23.88%
1 janv. 1993
26.97 mln.
+3.67 mln.
15.75%
1 janv. 1994
28.16 mln.
+1.19 mln.
4.41%
1 janv. 1995
28.72 mln.
+560.0 milles
1.99%
1 janv. 1996
28.1 mln.
-620.0 milles
-2.16%
1 janv. 1997
22.2 mln.
-5.9 mln.
-21.0%
1 janv. 1998
22.72 mln.
+520.0 milles
2.34%
1 janv. 1999
25.22 mln.
+2.5 mln.
11.0%
1 janv. 2000
26.21 mln.
+990.0 milles
3.93%
1 janv. 2001
17.65 mln.
-8.56 mln.
-32.66%
1 janv. 2002
20.11 mln.
+2.46 mln.
13.94%
1 janv. 2003
15.58 mln.
-4.53 mln.
-22.53%
1 janv. 2004
19.07 mln.
+3.49 mln.
22.4%
1 janv. 2005
23.16 mln.
+4.09 mln.
21.45%
1 janv. 2006
20.96 mln.
-2.2 mln.
-9.5%
1 janv. 2007
15.67 mln.
-5.29 mln.
-25.24%
1 janv. 2008
13.61 mln.
-2.06 mln.
-13.15%
1 janv. 2009
15.29 mln.
+1.68 mln.
12.34%
1 janv. 2010
8.89 mln.
-6.4 mln.
-41.86%
1 janv. 2011
26.41 mln.
+17.52 mln.
197.08%
1 janv. 2012
23.49 mln.
-2.92 mln.
-11.06%
1 janv. 2013
12.85 mln.
-10.64 mln.
-45.3%
1 janv. 2014
10.34 mln.
-2.51 mln.
-19.53%
1 janv. 2015
4.09 mln.
-6.25 mln.
-60.44%
Classement des pays selon les statistiques actuelles par années


Commentaires: