29
/fr/
fr
AIzaSyAYiBZKx7MnpbEhh9jyipgxe19OcubqV5w
April 1, 2024
56398
Small states
SST
false
2
1
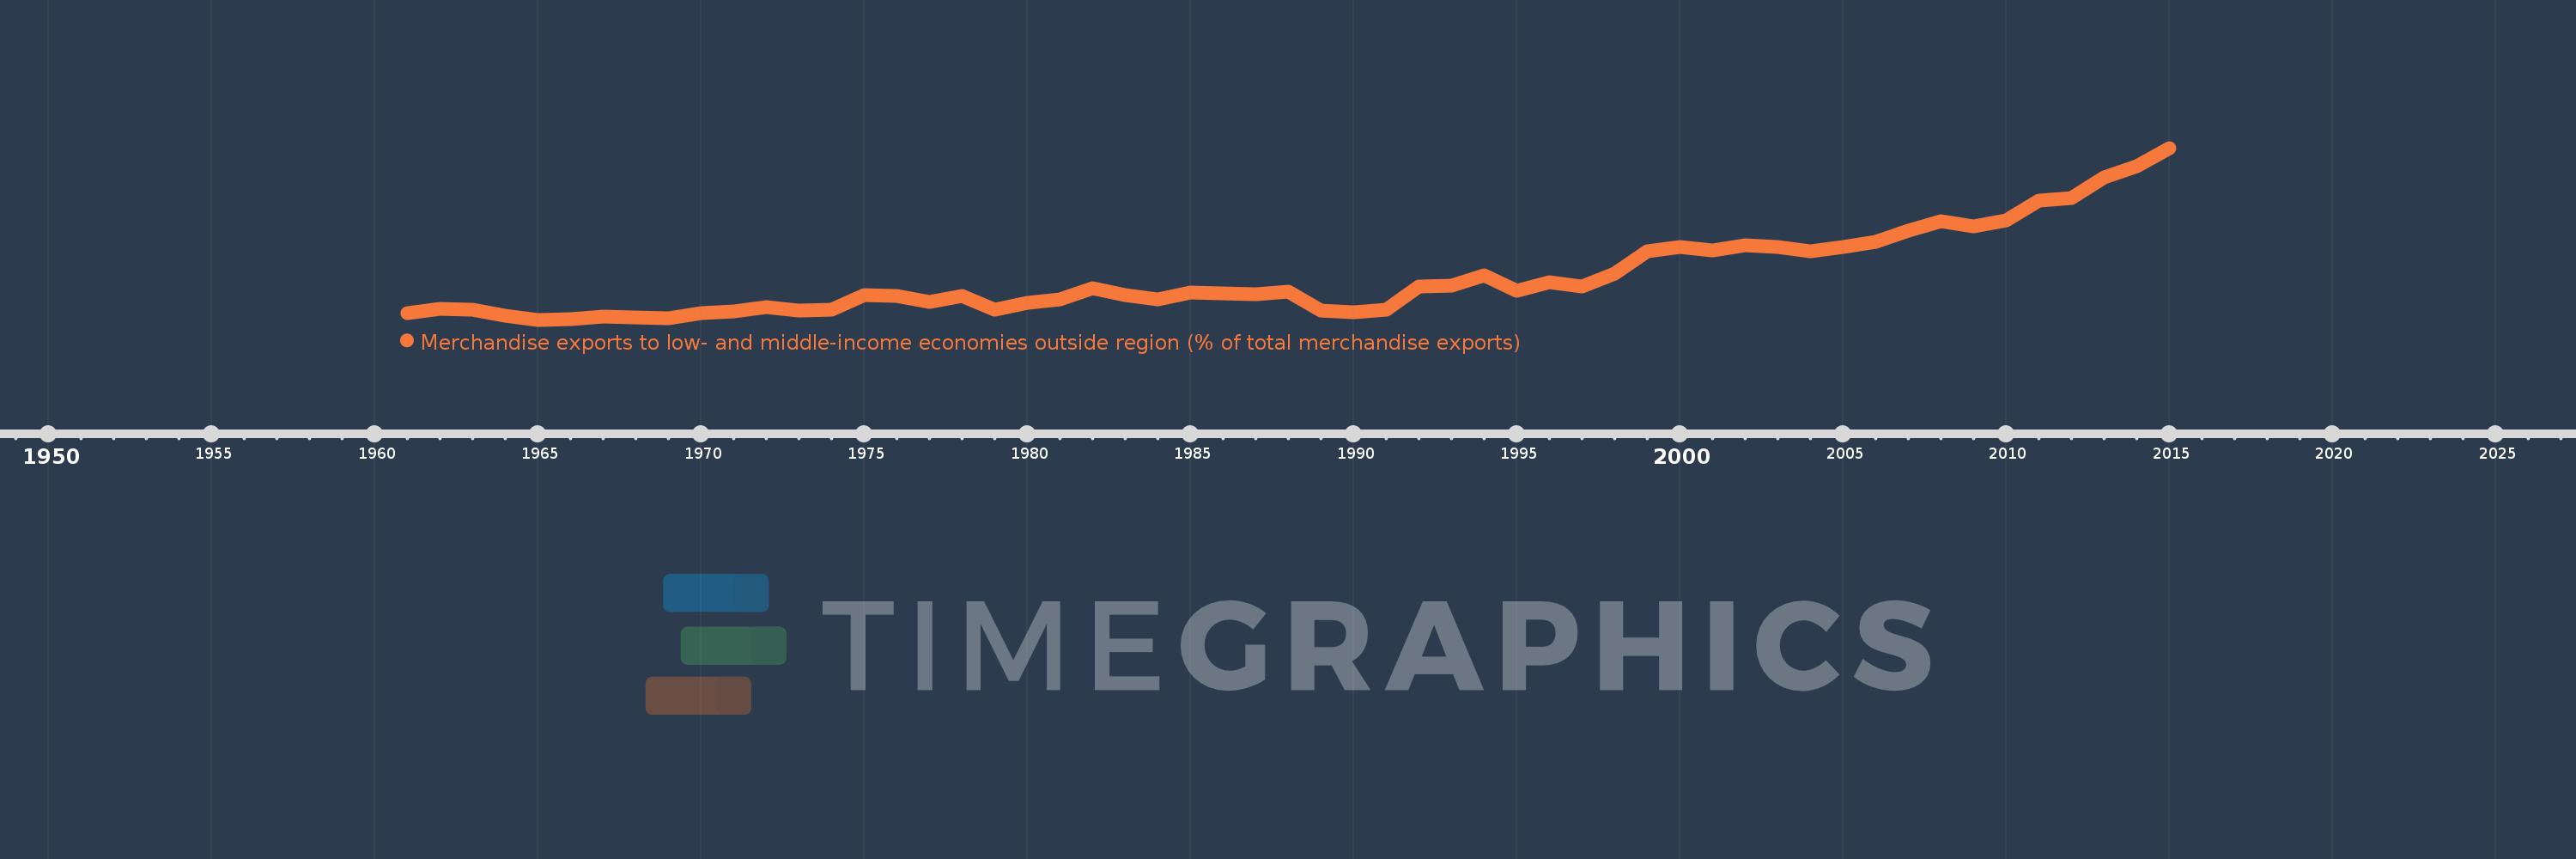
Merchandise exports to low- and middle-income economies outside region (% of total merchandise exports)
2015,2014,2013,2012,2011,2010,2009,2008,2007,2006,2005,2004,2003,2002,2001,2000,1999,1998,1997,1996,1995,1994,1993,1992,1991,1990,1989,1988,1987,1986,1985,1984,1983,1982,1981,1980,1979,1978,1977,1976,1975,1974,1973,1972,1971,1970,1969,1968,1967,1966,1965,1964,1963,1962,1961
Cette statistique dans les autres pays:
AfghanistanAlbaniaAlgeriaAngolaArab WorldArgentinaArmeniaArubaAustraliaAustriaAzerbaijanBahamas, TheBahrainBangladeshBarbadosBelarusBelgiumBelizeBeninBermudaBoliviaBrazilBrunei DarussalamBulgariaBurundiCabo VerdeCambodiaCameroonCanadaCaribbean small statesCentral African RepublicCentral Europe and the BalticsChileChinaColombiaCongo, Dem. Rep.Congo, Rep.Costa RicaCote d'IvoireCroatiaCubaCyprusCzech RepublicDenmarkDominicaDominican RepublicEarly-demographic dividendEast Asia & PacificEast Asia & Pacific (excluding high income)East Asia & Pacific (IDA & IBRD countries)EcuadorEgypt, Arab Rep.El SalvadorEstoniaEthiopiaEuro areaEurope & Central AsiaEurope & Central Asia (excluding high income)Europe & Central Asia (IDA & IBRD countries)European UnionFijiFinlandFragile and conflict affected situationsFranceGabonGambia, TheGeorgiaGermanyGhanaGreeceGreenlandGuatemalaGuineaGuyanaHaitiHeavily indebted poor countries (HIPC)High incomeHondurasHong Kong SAR, ChinaHungaryIBRD onlyIcelandIDA & IBRD totalIDA blendIDA onlyIDA totalIndiaIndonesiaIran, Islamic Rep.IraqIrelandIsraelItalyJamaicaJapanJordanKazakhstanKenyaKorea, Dem. People’s Rep.Korea, Rep.KuwaitLao PDRLate-demographic dividendLatin America & Caribbean Latin America & Caribbean (excluding high income)Latin America & the Caribbean (IDA & IBRD countries)LatviaLeast developed countries: UN classificationLebanonLiberiaLibyaLithuaniaLow & middle incomeLow incomeLower middle incomeLuxembourgMacao SAR, ChinaMacedonia, FYRMadagascarMalawiMalaysiaMaliMaltaMauritaniaMauritiusMexicoMiddle East & North AfricaMiddle East & North Africa (excluding high income)Middle East & North Africa (IDA & IBRD countries)Middle incomeMoldovaMongoliaMontenegroMoroccoMozambiqueMyanmarNetherlandsNew CaledoniaNew ZealandNicaraguaNigerNigeriaNorth AmericaNorwayOECD membersOmanOther small statesPacific island small statesPakistanPanamaPapua New GuineaParaguayPeruPhilippinesPolandPortugalPost-demographic dividendPre-demographic dividendQatarRomaniaRussian FederationRwandaSamoaSaudi ArabiaSenegalSerbiaSeychellesSierra LeoneSingaporeSlovak RepublicSloveniaSmall statesSomaliaSouth AfricaSouth AsiaSouth Asia (IDA & IBRD)SpainSri LankaSt. LuciaSt. Vincent and the GrenadinesSub-Saharan Africa Sub-Saharan Africa (excluding high income)Sub-Saharan Africa (IDA & IBRD countries)SudanSurinameSwedenSwitzerlandSyrian Arab RepublicTanzaniaThailandTogoTrinidad and TobagoTunisiaTurkeyUgandaUkraineUnited Arab EmiratesUnited KingdomUnited StatesUpper middle incomeUruguayVenezuela, RBVietnamWorldYemen, Rep.ZambiaZimbabwe La ligne de temps
Cette échelle de temps montre un graphique de 1961 année à 2015 année Small states. Les données jusqu'à 1960 année ne sont pas présentés. Quantité d'observations actuelles selon dates: 55.
Source (désignation):
Les indicateurs du développement mondiale
Source (organisation):
World Bank staff estimates based data from International Monetary Fund's Direction of Trade database.
Catégories:
Private Sector, Trade
Dernière mise à jour
23 avr. 2017
Les indicateurs de changement de valeurs selon les années
Minimum:
2.171
1 janv. 1965
Maximum:
22.306
1 janv. 2015
Pour la date d''observation
Valeur
Changement absolu
Le changement par rapport à la valeur précédente
1 janv. 1961
2.99
+2.99
0.0%
1 janv. 1962
3.445
+0.455
15.22%
1 janv. 1963
3.326
-0.119
-3.45%
1 janv. 1964
2.658
-0.668
-20.08%
1 janv. 1965
2.171
-0.488
-18.34%
1 janv. 1966
2.223
+0.052
2.4%
1 janv. 1967
2.512
+0.289
13.0%
1 janv. 1968
2.474
-0.037
-1.49%
1 janv. 1969
2.373
-0.102
-4.11%
1 janv. 1970
2.991
+0.618
26.07%
1 janv. 1971
3.175
+0.184
6.14%
1 janv. 1972
3.659
+0.484
15.26%
1 janv. 1973
3.263
-0.396
-10.82%
1 janv. 1974
3.356
+0.093
2.84%
1 janv. 1975
5.053
+1.698
50.59%
1 janv. 1976
4.94
-0.113
-2.24%
1 janv. 1977
4.22
-0.72
-14.58%
1 janv. 1978
4.92
+0.7
16.6%
1 janv. 1979
3.348
-1.572
-31.96%
1 janv. 1980
4.2
+0.852
25.45%
1 janv. 1981
4.578
+0.378
9.0%
1 janv. 1982
5.835
+1.257
27.46%
1 janv. 1983
5.083
-0.752
-12.89%
1 janv. 1984
4.573
-0.51
-10.04%
1 janv. 1985
5.35
+0.777
17.0%
1 janv. 1986
5.246
-0.104
-1.95%
1 janv. 1987
5.134
-0.112
-2.13%
1 janv. 1988
5.462
+0.328
6.38%
1 janv. 1989
3.248
-2.214
-40.54%
1 janv. 1990
3.073
-0.175
-5.39%
1 janv. 1991
3.315
+0.242
7.88%
1 janv. 1992
6.093
+2.778
83.82%
1 janv. 1993
6.167
+0.074
1.21%
1 janv. 1994
7.385
+1.218
19.74%
1 janv. 1995
5.612
-1.772
-24.0%
1 janv. 1996
6.528
+0.916
16.33%
1 janv. 1997
6.091
-0.437
-6.7%
1 janv. 1998
7.614
+1.523
25.0%
1 janv. 1999
10.155
+2.541
33.38%
1 janv. 2000
10.696
+0.541
5.33%
1 janv. 2001
10.319
-0.377
-3.53%
1 janv. 2002
10.868
+0.549
5.32%
1 janv. 2003
10.736
-0.131
-1.21%
1 janv. 2004
10.211
-0.525
-4.89%
1 janv. 2005
10.708
+0.497
4.87%
1 janv. 2006
11.32
+0.612
5.72%
1 janv. 2007
12.586
+1.266
11.18%
1 janv. 2008
13.689
+1.103
8.76%
1 janv. 2009
13.093
-0.596
-4.35%
1 janv. 2010
13.834
+0.741
5.66%
1 janv. 2011
16.156
+2.322
16.78%
1 janv. 2012
16.429
+0.274
1.69%
1 janv. 2013
18.846
+2.417
14.71%
1 janv. 2014
20.129
+1.282
6.8%
1 janv. 2015
22.306
+2.177
10.82%
Classement des pays selon les statistiques actuelles par années


Commentaires: